\n
## Heatmap: Numerical Grid
### Overview
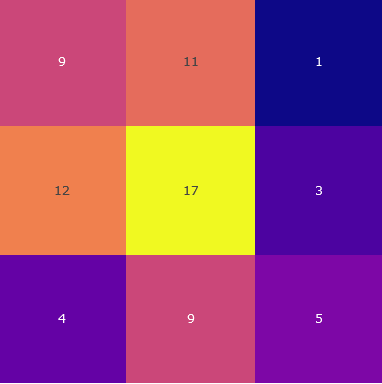
The image presents a 3x3 heatmap displaying numerical values within a color-coded grid. The color gradient ranges from dark purple (low values) to yellow (high values). Each cell in the grid contains a single numerical value.
### Components/Axes
The image lacks explicit axis labels or a legend. However, the grid structure implies a two-dimensional arrangement of data. The color scheme serves as a visual representation of the data's magnitude.
### Detailed Analysis
The grid contains the following numerical values, mapped to their corresponding colors:
* **Top-Left:** 9 (Orange-Purple)
* **Top-Center:** 11 (Orange)
* **Top-Right:** 1 (Dark Purple)
* **Middle-Left:** 12 (Orange)
* **Middle-Center:** 17 (Yellow)
* **Middle-Right:** 3 (Dark Purple)
* **Bottom-Left:** 4 (Purple)
* **Bottom-Center:** 9 (Pink-Purple)
* **Bottom-Right:** 5 (Purple)
The color gradient suggests that the value 17 is the highest, while 1 and 3 are the lowest. The values generally increase from the dark purple areas towards the yellow center.
### Key Observations
* The highest value (17) is located in the center of the grid.
* The lowest values (1 and 3) are located in the top-right and middle-right cells, respectively.
* There is a noticeable color contrast between the center cell (17) and the surrounding cells.
* The value 9 appears twice, once in the top-left and once in the bottom-center.
### Interpretation
The heatmap likely represents a correlation or distribution of some underlying data. The central high value (17) could indicate a point of maximum concentration or intensity. The lower values on the right side might represent areas of lower concentration or weaker correlation. Without knowing the context of the data, it's difficult to draw definitive conclusions. However, the pattern suggests a potential peak in the center and a gradual decrease towards the right. The repetition of the value 9 could indicate a consistent factor or relationship within the dataset. The image is a simple visualization of numerical data, and its meaning is dependent on the variables it represents.