## Bayesian Network: Box to E1-E5
### Overview
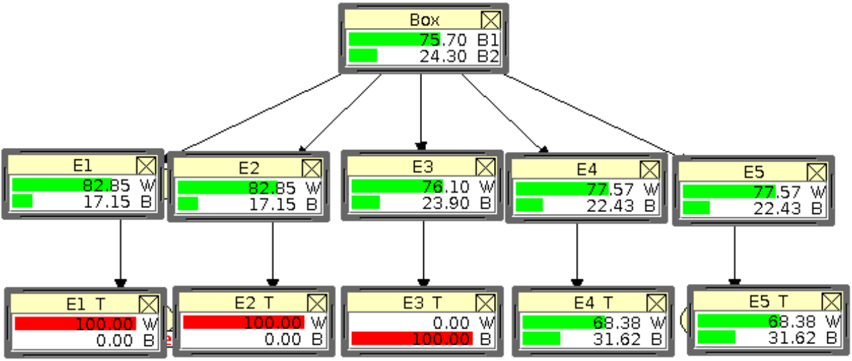
The image depicts a Bayesian network with a root node labeled "Box" and two layers of child nodes labeled "E1" through "E5" and "E1 T" through "E5 T". Each node displays two values, "W" and "B" or "B1" and "B2", along with a colored bar representing the proportion of each value. The color of the bar is green for "W" and "B1", and red for "B" and "B2". Arrows indicate the probabilistic dependencies between the nodes.
### Components/Axes
* **Nodes:** The network consists of 11 nodes arranged in a hierarchical structure.
* **Root Node:** "Box"
* **Intermediate Nodes:** "E1", "E2", "E3", "E4", "E5"
* **Leaf Nodes:** "E1 T", "E2 T", "E3 T", "E4 T", "E5 T"
* **Edges:** Arrows connect the nodes, indicating the direction of probabilistic influence. The "Box" node has edges pointing to each of the "E1" through "E5" nodes. Each of the "E1" through "E5" nodes has an edge pointing to its corresponding "E1 T" through "E5 T" node.
* **Values:** Each node displays two values, labeled "W" and "B" (or "B1" and "B2" for the "Box" node), representing probabilities or proportions.
* **Color Coding:**
* Green: Represents "W" or "B1"
* Red: Represents "B" or "B2"
### Detailed Analysis or ### Content Details
**Root Node: Box**
* B1: 75.70 (Green bar is dominant)
* B2: 24.30 (Red bar is smaller)
**Intermediate Nodes (E1 - E5):**
* **E1:**
* W: 82.85 (Green bar is dominant)
* B: 17.15 (Red bar is smaller)
* **E2:**
* W: 82.85 (Green bar is dominant)
* B: 17.15 (Red bar is smaller)
* **E3:**
* W: 76.10 (Green bar is dominant)
* B: 23.90 (Red bar is smaller)
* **E4:**
* W: 77.57 (Green bar is dominant)
* B: 22.43 (Red bar is smaller)
* **E5:**
* W: 77.57 (Green bar is dominant)
* B: 22.43 (Red bar is smaller)
**Leaf Nodes (E1 T - E5 T):**
* **E1 T:**
* W: 100.00 (Green bar is absent)
* B: 0.00 (Red bar is dominant)
* **E2 T:**
* W: 100.00 (Green bar is absent)
* B: 0.00 (Red bar is dominant)
* **E3 T:**
* W: 0.00 (Green bar is absent)
* B: 100.00 (Red bar is dominant)
* **E4 T:**
* W: 68.38 (Green bar is dominant)
* B: 31.62 (Red bar is smaller)
* **E5 T:**
* W: 68.38 (Green bar is dominant)
* B: 31.62 (Red bar is smaller)
### Key Observations
* The "Box" node has a higher probability for "B1" (75.70) compared to "B2" (24.30).
* Nodes "E1" and "E2" have identical probabilities for "W" and "B" (82.85 and 17.15, respectively).
* Nodes "E4" and "E5" also have identical probabilities for "W" and "B" (77.57 and 22.43, respectively).
* Nodes "E1 T" and "E2 T" have a "W" value of 100.00 and a "B" value of 0.00.
* Node "E3 T" has a "W" value of 0.00 and a "B" value of 100.00.
* Nodes "E4 T" and "E5 T" have identical probabilities for "W" and "B" (68.38 and 31.62, respectively).
### Interpretation
The Bayesian network models the probabilistic relationships between the "Box" node and the "E1" through "E5" nodes, and subsequently, the "E1 T" through "E5 T" nodes. The values represent conditional probabilities. For example, the values in "E1" indicate the probability of "W" and "B" given the state of the "Box" node. The values in "E1 T" indicate the probability of "W" and "B" given the state of "E1".
The network suggests that the "Box" node influences the states of "E1" through "E5". The states of "E1" through "E5" then influence the states of "E1 T" through "E5 T". The extreme values (0.00 and 100.00) in "E1 T", "E2 T", and "E3 T" suggest a strong deterministic relationship between their parent nodes ("E1", "E2", "E3") and themselves. The other nodes have more balanced probabilities, indicating a less deterministic relationship.