## Diagram: Hierarchical Box Structure with Percentage Values
### Overview
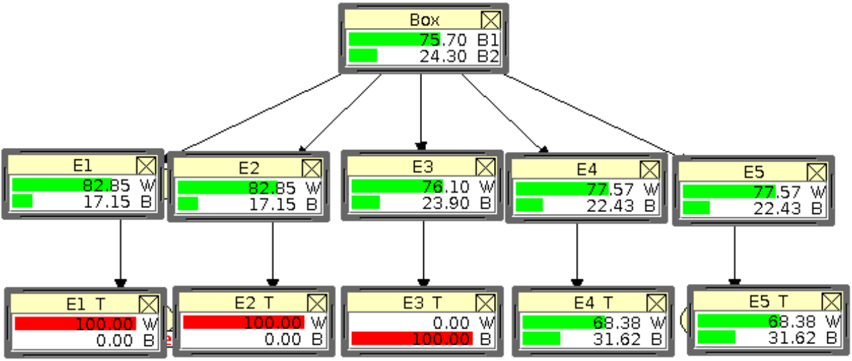
The image depicts a hierarchical diagram representing a box structure with nested elements. Each box displays percentage values labeled as "W" and "B", along with a box identifier (e.g., "Box", "E1", "E1 T"). The diagram shows a top-down flow of information, with the "Box" at the top level branching into "E1" through "E5", which further branch into "E1 T" through "E5 T". Arrows indicate the direction of the hierarchy.
### Components/Axes
The diagram consists of three levels of boxes:
* **Level 1:** "Box"
* **Level 2:** "E1", "E2", "E3", "E4", "E5"
* **Level 3:** "E1 T", "E2 T", "E3 T", "E4 T", "E5 T"
Each box contains the following labels:
* A box identifier (e.g., "Box", "E1", "E1 T")
* A percentage value labeled "W"
* A percentage value labeled "B"
* A small "X" symbol in the top-right corner of each box.
The diagram uses arrows to show the hierarchical relationships between the boxes.
### Detailed Analysis or Content Details
Here's a breakdown of the values within each box:
* **Box:**
* W: 75.70 (approximately)
* B: 24.30 (approximately)
* **E1:**
* W: 82.85 (approximately)
* B: 17.15 (approximately)
* **E2:**
* W: 82.85 (approximately)
* B: 17.15 (approximately)
* **E3:**
* W: 76.10 (approximately)
* B: 23.90 (approximately)
* **E4:**
* W: 77.57 (approximately)
* B: 22.43 (approximately)
* **E5:**
* W: 77.57 (approximately)
* B: 22.43 (approximately)
* **E1 T:**
* W: 100.00 (approximately)
* B: 0.00 (approximately)
* **E2 T:**
* W: 100.00 (approximately)
* B: 0.00 (approximately)
* **E3 T:**
* W: 100.00 (approximately)
* B: 0.00 (approximately)
* **E4 T:**
* W: 68.38 (approximately)
* B: 31.62 (approximately)
* **E5 T:**
* W: 68.38 (approximately)
* B: 31.62 (approximately)
### Key Observations
* The "W" and "B" values likely represent weights or proportions of two different components.
* The values of "W" decrease as you move down the hierarchy, while the values of "B" generally increase (except for E1, E2, and E3).
* Boxes E1 T, E2 T, and E3 T have 100% "W" and 0% "B", indicating a complete shift in composition.
* Boxes E4 T and E5 T have a significant "B" component (31.62%), suggesting a partial shift in composition.
* E1 and E2 have identical values.
### Interpretation
This diagram likely represents a decomposition or distribution of some quantity (represented by "W" and "B") across a hierarchical structure. The "Box" represents the total quantity, which is then divided into components "E1" through "E5". These components are further subdivided into "E1 T" through "E5 T".
The values suggest that the initial composition is heavily weighted towards "W" (75.70%). As you move down the hierarchy, the proportion of "W" decreases, and the proportion of "B" increases. The complete shift to "W" in E1 T, E2 T, and E3 T indicates a complete transformation or allocation of those components. The partial shift in E4 T and E5 T suggests a more balanced allocation or a different transformation process.
The identical values for E1 and E2 could indicate that they represent the same component or process. The diagram could be visualizing a process of filtering, sorting, or allocation where the initial input ("Box") is divided into different streams ("E1" - "E5") and then further processed ("E1 T" - "E5 T"). The "X" symbol in each box might indicate a status or a control point within the process.