# Technical Document Analysis: High-d Case Coverage Rate Chart
## Chart Title
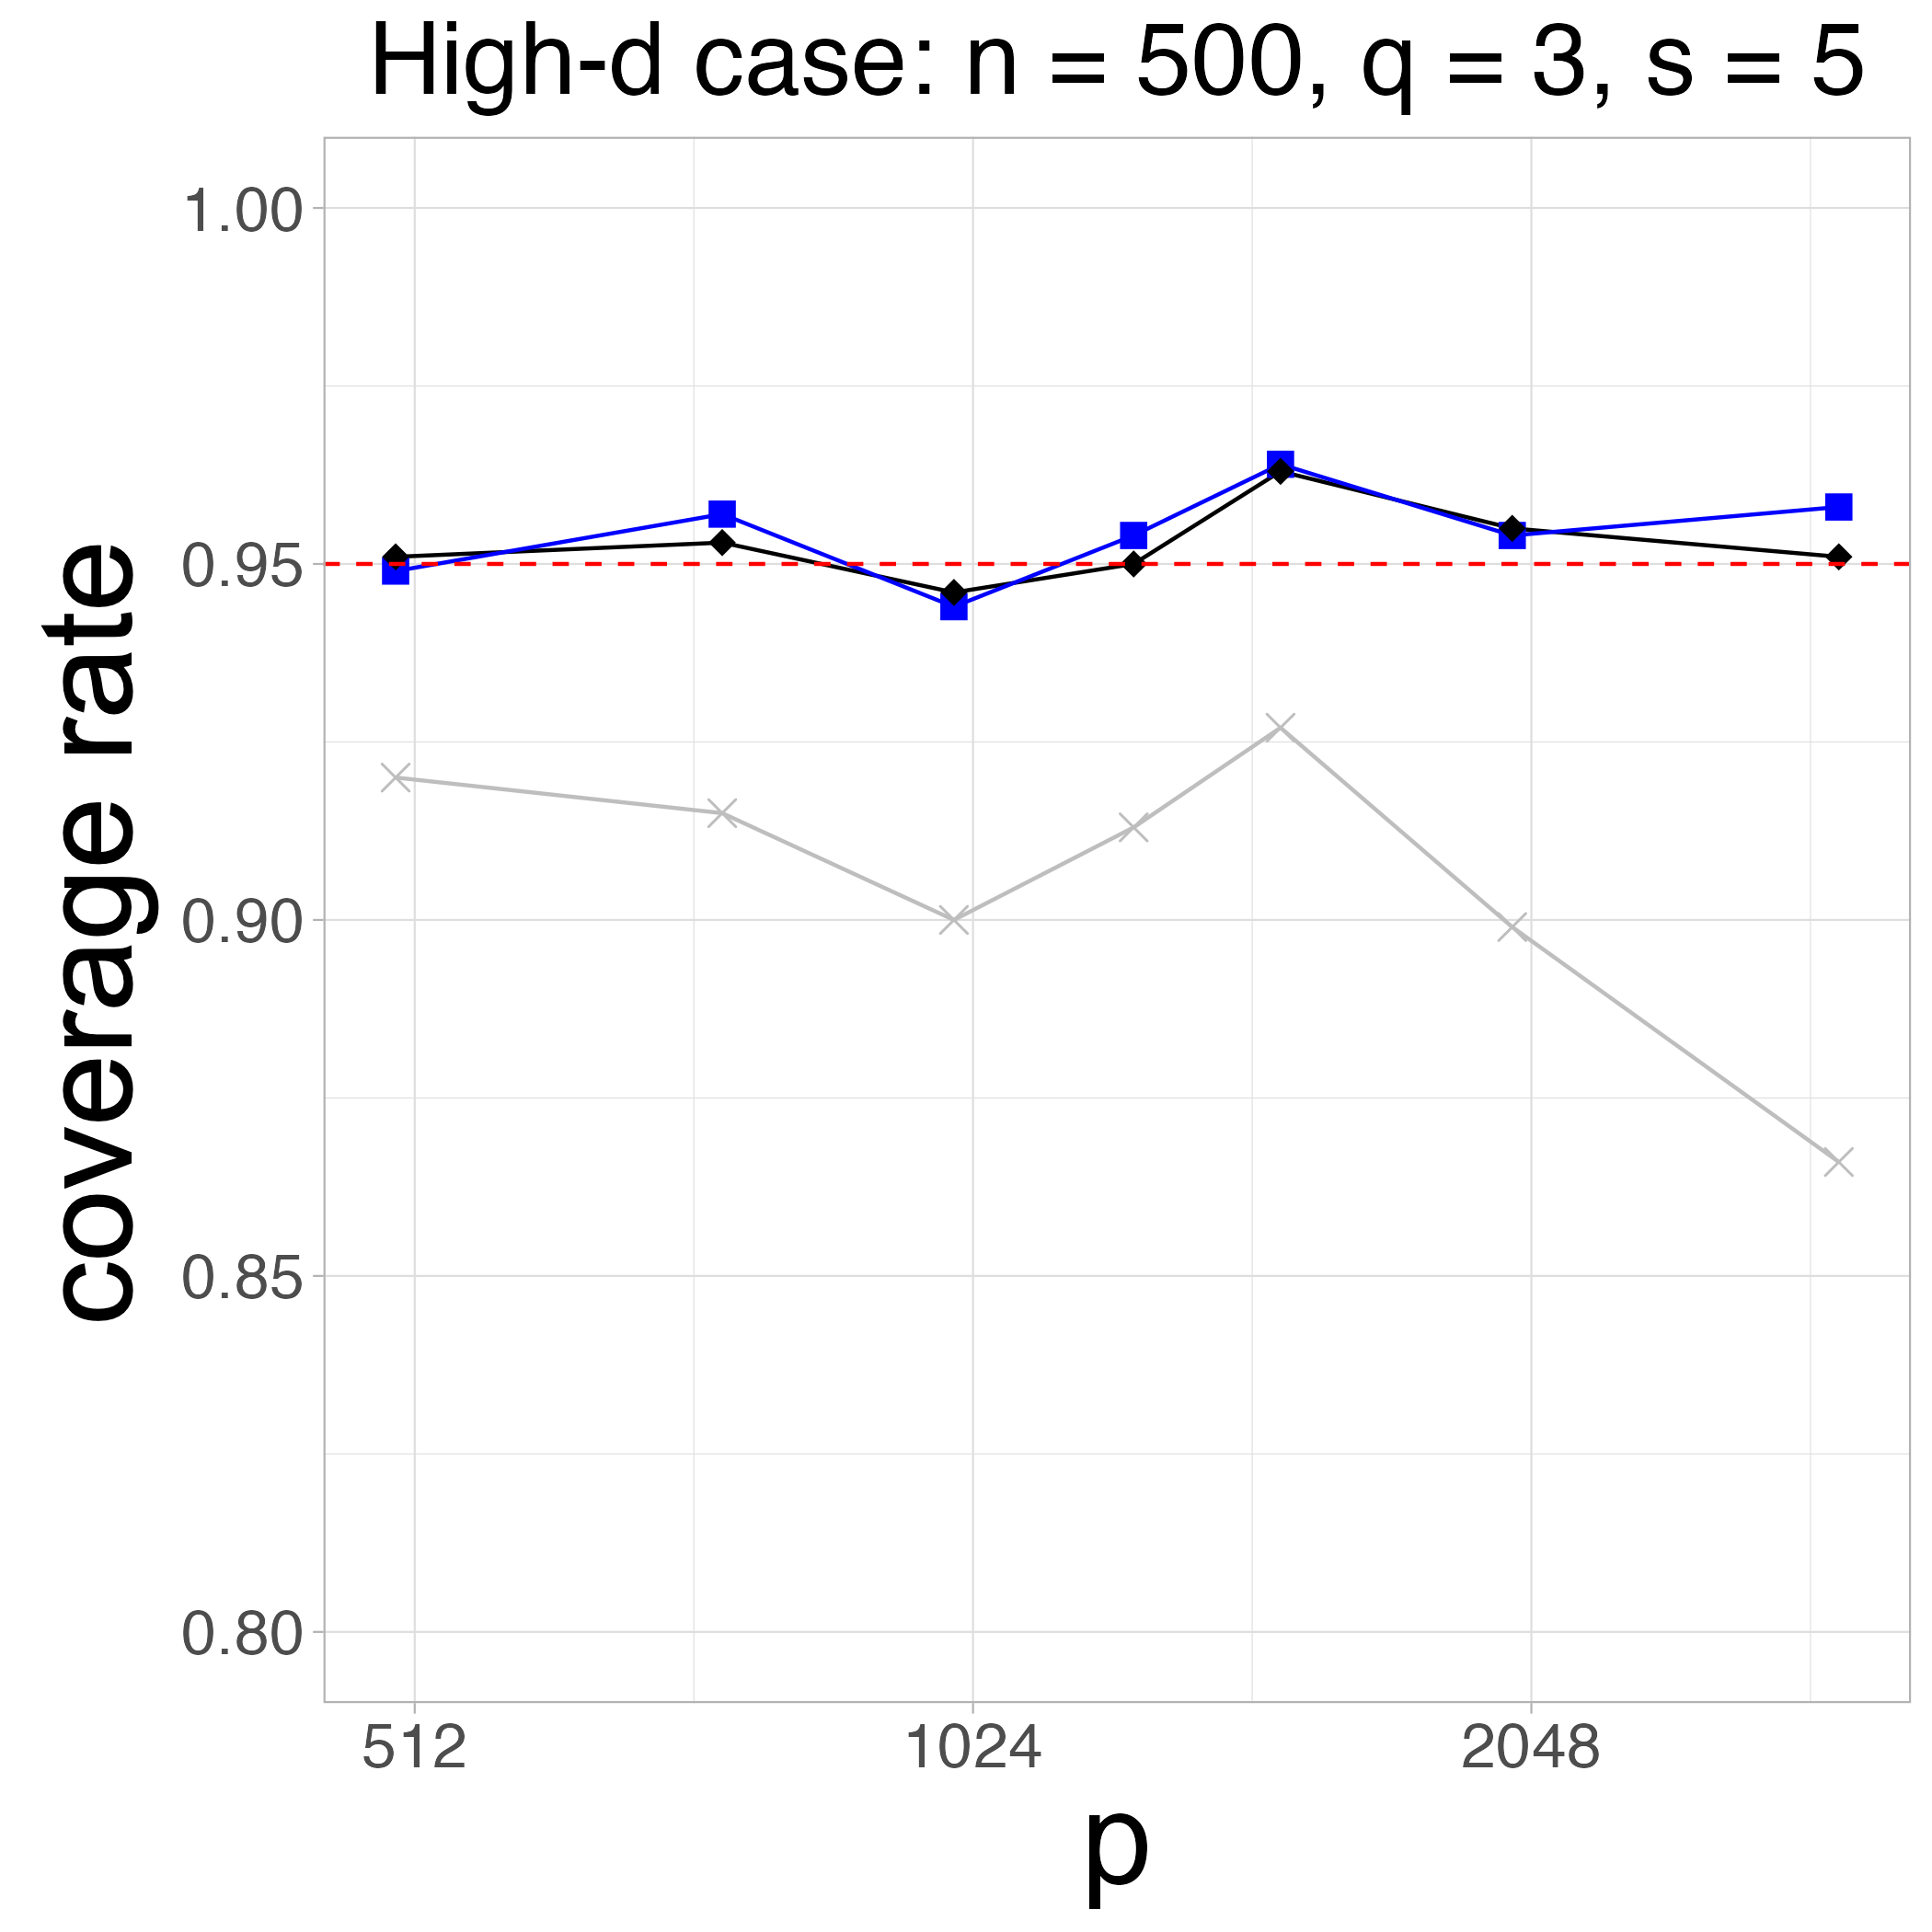
**High-d case: n = 500, q = 3, s = 5**
## Axes Labels
- **X-axis**: `p` (values: 512, 1024, 2048)
- **Y-axis**: `coverage rate` (range: 0.80 to 1.00, increments of 0.05)
## Legend
- **Blue squares**: Data series 1
- **Black diamonds**: Data series 2
- **Gray crosses**: Data series 3
- **Red dashed line**: Reference threshold at `0.95`
## Data Series Trends
1. **Blue Line (Squares)**:
- **Trend**: Peaks at `p = 1024` (coverage rate ~0.96), dips slightly at `p = 2048` (~0.95), then stabilizes.
- **Key Points**:
- `p = 512`: ~0.95
- `p = 1024`: ~0.96
- `p = 2048`: ~0.95
2. **Black Line (Diamonds)**:
- **Trend**: Fluctuates around `0.95`, with a minor dip at `p = 1024` (~0.945), then stabilizes.
- **Key Points**:
- `p = 512`: ~0.95
- `p = 1024`: ~0.945
- `p = 2048`: ~0.95
3. **Gray Line (Crosses)**:
- **Trend**: Steady decline from `p = 512` (~0.92) to `p = 2048` (~0.87).
- **Key Points**:
- `p = 512`: ~0.92
- `p = 1024`: ~0.90
- `p = 2048`: ~0.87
## Reference Line
- **Red dashed line**: Horizontal reference at `coverage rate = 0.95`.
## Spatial Grounding
- **Legend Position**: Right-aligned, adjacent to the chart.
- **Color Consistency**:
- Blue squares match the blue line.
- Black diamonds match the black line.
- Gray crosses match the gray line.
## Component Isolation
1. **Header**: Chart title and parameters (`n = 500, q = 3, s = 5`).
2. **Main Chart**:
- Three data series with distinct markers.
- Red dashed reference line.
3. **Footer**: No additional text or annotations.
## Observations
- The blue line (squares) exhibits the highest coverage rate, peaking at `p = 1024`.
- The gray line (crosses) shows the most significant decline, dropping below `0.90` at `p = 2048`.
- The black line (diamonds) remains relatively stable, hovering near the `0.95` threshold.
## Notes
- No additional text, tables, or non-English content is present.
- All data points align with their respective legend entries.