## Line Graph: Probe Accuracy vs. SAE Sparsity Ratio
### Overview
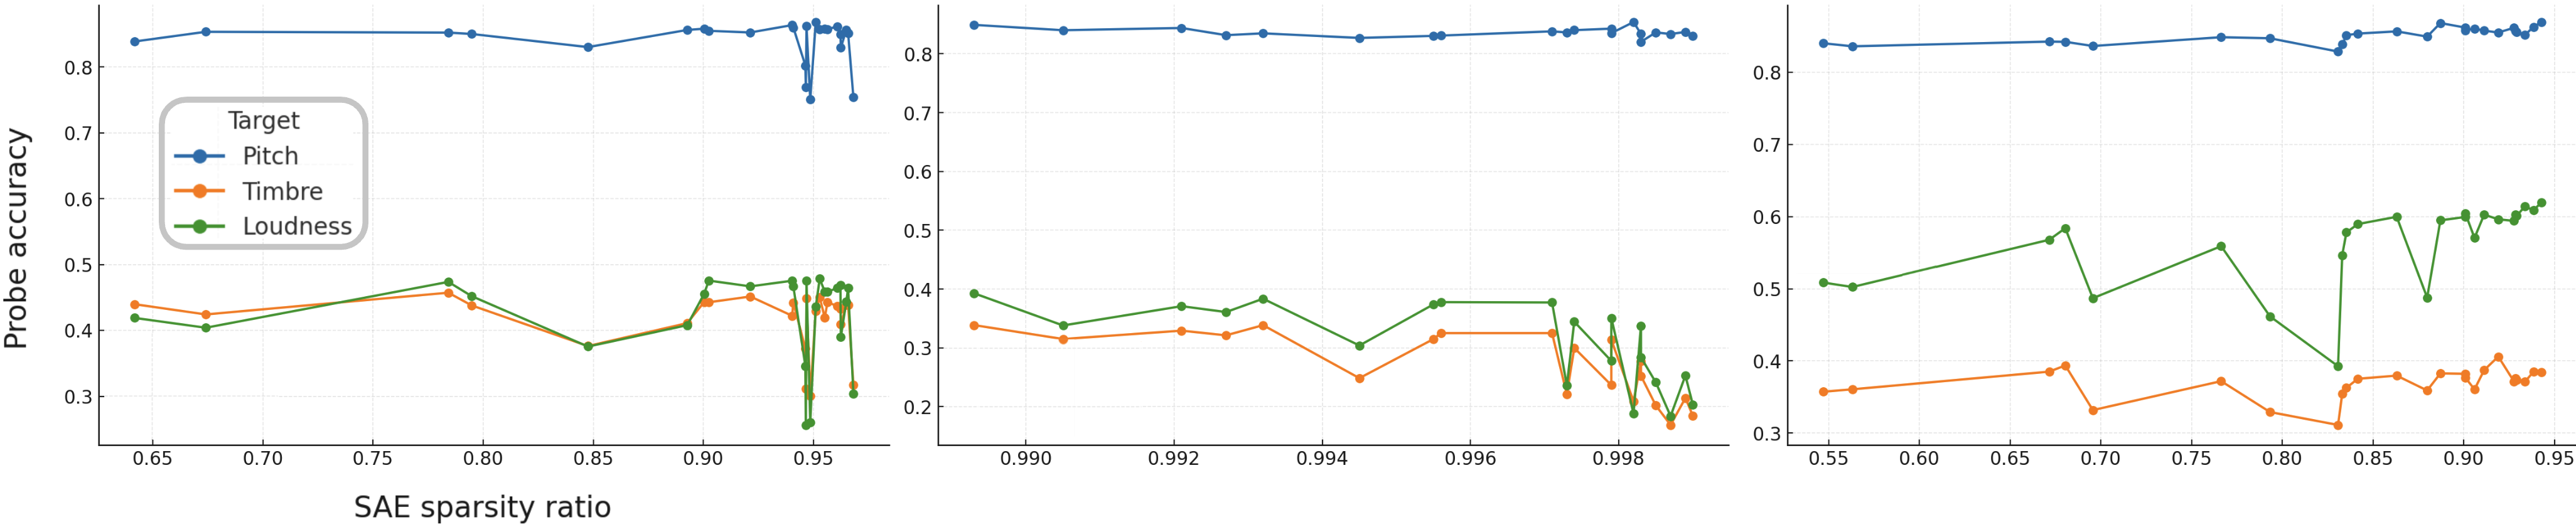
The image displays three line graphs comparing probe accuracy across different SAE sparsity ratios (0.65–0.95). Three data series are represented: **Target** (blue), **Pitch** (orange), and **Timbre** (green). The graphs are divided into three panels, each showing similar trends but with slight variations in data point distributions.
---
### Components/Axes
- **X-axis**: SAE sparsity ratio (0.65–0.95, incrementing by 0.05).
- **Y-axis**: Probe accuracy (0.2–0.8, incrementing by 0.1).
- **Legend**:
- **Target** (blue line)
- **Pitch** (orange line)
- **Timbre** (green line)
- **Loudness** (blue line, but no corresponding line in the graph; likely a legend error).
---
### Detailed Analysis
#### Panel 1 (Left)
- **Target (blue)**: Stable at ~0.85 across all sparsity ratios.
- **Pitch (orange)**: Fluctuates between ~0.3 and ~0.4, peaking near 0.75 sparsity.
- **Timbre (green)**: Peaks at ~0.45 near 0.75 sparsity, then declines.
#### Panel 2 (Middle)
- **Target (blue)**: Consistent at ~0.85.
- **Pitch (orange)**: Drops to ~0.3 at 0.95 sparsity, with minor fluctuations.
- **Timbre (green)**: Peaks at ~0.4 near 0.90 sparsity, then declines sharply.
#### Panel 3 (Right)
- **Target (blue)**: Stable at ~0.85.
- **Pitch (orange)**: Peaks at ~0.35 near 0.90 sparsity, with erratic drops.
- **Timbre (green)**: Peaks at ~0.55 near 0.90 sparsity, with significant volatility.
---
### Key Observations
1. **Target Stability**: The blue line (Target) remains consistently high (~0.85) across all panels, suggesting robustness to sparsity changes.
2. **Pitch Variability**: The orange line (Pitch) shows the most pronounced fluctuations, particularly in Panels 2 and 3, where accuracy drops sharply at higher sparsity ratios.
3. **Timbre Trends**: The green line (Timbre) exhibits moderate stability in Panel 1 but becomes increasingly volatile in Panels 2 and 3, with notable dips at 0.95 sparsity.
4. **Legend Discrepancy**: The legend includes "Loudness" (blue) but no corresponding line in the graph, indicating a potential error in labeling.
---
### Interpretation
- **Target Consistency**: The Target’s stable accuracy implies it is less sensitive to SAE sparsity changes, possibly due to optimized feature extraction or redundancy.
- **Pitch and Timbre Sensitivity**: The orange and green lines suggest that Pitch and Timbre accuracy degrade as sparsity increases, with Timbre showing greater instability in later panels. This could indicate that these features rely more heavily on dense data representations.
- **Anomalies**: The sharp drops in Pitch and Timbre at 0.95 sparsity (Panels 2 and 3) may reflect data sparsity thresholds where critical information is lost, leading to accuracy declines.
- **Legend Error**: The inclusion of "Loudness" in the legend without a corresponding line suggests a mislabeling or missing data series, which could mislead interpretation.
---
### Conclusion
The data highlights a trade-off between SAE sparsity and probe accuracy, with Target maintaining high performance while Pitch and Timbre degrade under higher sparsity. The legend inconsistency underscores the need for careful validation of data series labels. These trends may inform strategies for balancing model efficiency (via sparsity) and accuracy in applications like audio or speech processing.