## Bar and Line Chart: R1-Llama vs. R1-Qwen Performance
### Overview
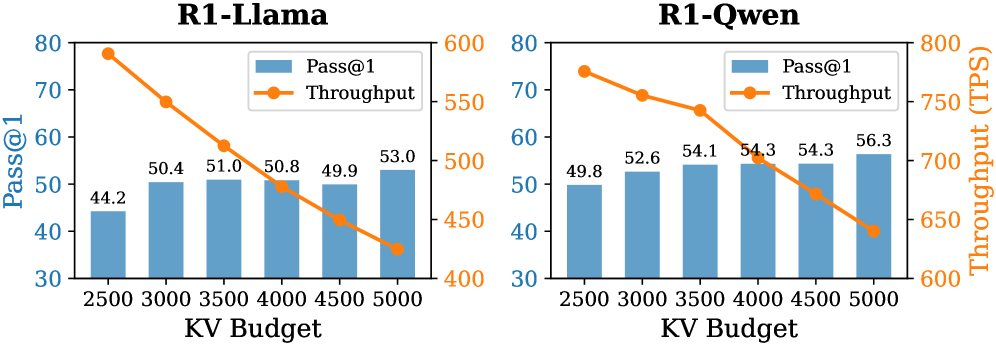
The image presents two combined bar and line charts comparing the performance of "R1-Llama" and "R1-Qwen" models. Each chart plots "Pass@1" (as blue bars) and "Throughput" (as an orange line) against varying "KV Budget" values. The charts aim to illustrate the relationship between KV Budget, Pass@1 accuracy, and Throughput for each model.
### Components/Axes
* **Titles:**
* Left Chart: "R1-Llama"
* Right Chart: "R1-Qwen"
* **X-Axis (Shared):** "KV Budget" with values 2500, 3000, 3500, 4000, 4500, and 5000.
* **Left Y-Axis:** "Pass@1" ranging from 30 to 80.
* **Right Y-Axis:** "Throughput (TPS)" ranging from 600 to 800 (for R1-Qwen) and 400 to 600 (for R1-Llama).
* **Legend (Top-Center of each chart):**
* Blue bars: "Pass@1"
* Orange line: "Throughput"
### Detailed Analysis
**R1-Llama Chart:**
* **Pass@1 (Blue Bars):** The Pass@1 accuracy generally increases with the KV Budget.
* KV Budget 2500: Pass@1 = 44.2
* KV Budget 3000: Pass@1 = 50.4
* KV Budget 3500: Pass@1 = 51.0
* KV Budget 4000: Pass@1 = 50.8
* KV Budget 4500: Pass@1 = 49.9
* KV Budget 5000: Pass@1 = 53.0
* **Throughput (Orange Line):** The Throughput decreases as the KV Budget increases.
* KV Budget 2500: Throughput = 578 TPS (approximate)
* KV Budget 3000: Throughput = 525 TPS (approximate)
* KV Budget 3500: Throughput = 490 TPS (approximate)
* KV Budget 4000: Throughput = 470 TPS (approximate)
* KV Budget 4500: Throughput = 450 TPS (approximate)
* KV Budget 5000: Throughput = 420 TPS (approximate)
**R1-Qwen Chart:**
* **Pass@1 (Blue Bars):** The Pass@1 accuracy generally increases with the KV Budget.
* KV Budget 2500: Pass@1 = 49.8
* KV Budget 3000: Pass@1 = 52.6
* KV Budget 3500: Pass@1 = 54.1
* KV Budget 4000: Pass@1 = 54.3
* KV Budget 4500: Pass@1 = 54.3
* KV Budget 5000: Pass@1 = 56.3
* **Throughput (Orange Line):** The Throughput decreases as the KV Budget increases.
* KV Budget 2500: Throughput = 740 TPS (approximate)
* KV Budget 3000: Throughput = 700 TPS (approximate)
* KV Budget 3500: Throughput = 670 TPS (approximate)
* KV Budget 4000: Throughput = 670 TPS (approximate)
* KV Budget 4500: Throughput = 650 TPS (approximate)
* KV Budget 5000: Throughput = 620 TPS (approximate)
### Key Observations
* For both models, increasing the KV Budget generally improves the Pass@1 accuracy.
* For both models, increasing the KV Budget leads to a decrease in Throughput.
* R1-Qwen consistently achieves higher Throughput compared to R1-Llama across all KV Budget values.
* R1-Qwen also generally achieves higher Pass@1 accuracy compared to R1-Llama across all KV Budget values.
### Interpretation
The charts illustrate a trade-off between accuracy (Pass@1) and speed (Throughput) when adjusting the KV Budget for both R1-Llama and R1-Qwen models. Increasing the KV Budget allows the models to achieve higher accuracy, likely due to increased capacity to store and process information. However, this comes at the cost of reduced Throughput, possibly because larger KV Budgets require more computational resources and time to manage.
R1-Qwen appears to be a more efficient model than R1-Llama, as it achieves both higher accuracy and higher throughput across the tested KV Budget range. This suggests that R1-Qwen may have a more optimized architecture or implementation.
The data suggests that the optimal KV Budget would depend on the specific application and the relative importance of accuracy and speed. If accuracy is paramount, a higher KV Budget would be preferred. If speed is more critical, a lower KV Budget might be more suitable.