\n
## Bar and Line Chart: Performance vs. KV Budget for LLMs
### Overview
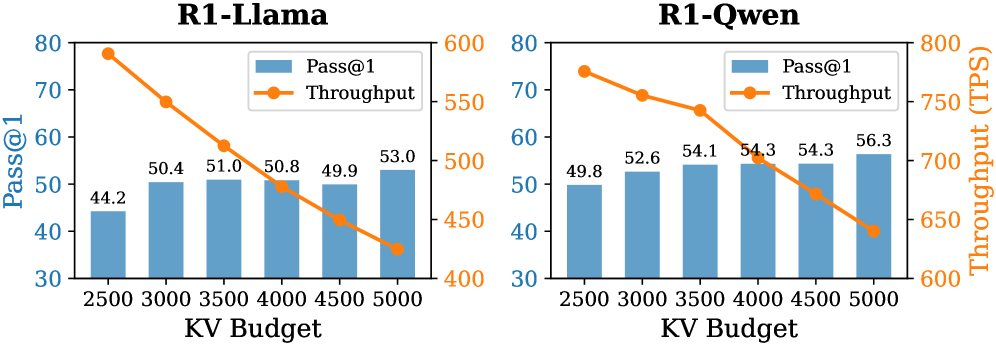
The image presents two comparative bar and line charts, side-by-side. Both charts illustrate the relationship between "KV Budget" (likely a computational resource allocation) and two performance metrics: "Pass@1" (a measure of accuracy) and "Throughput" (measured in Transactions Per Second - TPS). The left chart focuses on the "R1-Llama" model, while the right chart focuses on the "R1-Qwen" model. Both charts share the same x-axis (KV Budget) and y-axis scales, allowing for direct visual comparison.
### Components/Axes
* **X-axis:** "KV Budget" with values 2500, 3000, 3500, 4000, 4500, and 5000.
* **Left Y-axis:** "Pass@1" ranging from 30 to 80.
* **Right Y-axis:** "Throughput (TPS)" ranging from 400 to 800.
* **Legend (Top-Left of each chart):**
* Blue: "Pass@1" (represented by bars)
* Orange: "Throughput" (represented by a line)
* **Titles:**
* Left Chart: "R1-Llama"
* Right Chart: "R1-Qwen"
### Detailed Analysis or Content Details
**R1-Llama (Left Chart):**
* **Pass@1 (Blue Bars):**
* KV Budget 2500: Approximately 44.2
* KV Budget 3000: Approximately 50.4
* KV Budget 3500: Approximately 51.0
* KV Budget 4000: Approximately 50.8
* KV Budget 4500: Approximately 49.9
* KV Budget 5000: Approximately 53.0
* Trend: The Pass@1 metric initially increases from 2500 to 3500 KV Budget, then plateaus and slightly decreases before increasing again at 5000 KV Budget.
* **Throughput (Orange Line):**
* KV Budget 2500: Approximately 790 TPS
* KV Budget 3000: Approximately 710 TPS
* KV Budget 3500: Approximately 640 TPS
* KV Budget 4000: Approximately 570 TPS
* KV Budget 4500: Approximately 500 TPS
* KV Budget 5000: Approximately 430 TPS
* Trend: The Throughput metric consistently decreases as the KV Budget increases. The line slopes downward.
**R1-Qwen (Right Chart):**
* **Pass@1 (Blue Bars):**
* KV Budget 2500: Approximately 49.8
* KV Budget 3000: Approximately 52.6
* KV Budget 3500: Approximately 54.1
* KV Budget 4000: Approximately 54.3
* KV Budget 4500: Approximately 54.3
* KV Budget 5000: Approximately 56.3
* Trend: The Pass@1 metric generally increases with increasing KV Budget, with a plateau between 4000 and 4500.
* **Throughput (Orange Line):**
* KV Budget 2500: Approximately 770 TPS
* KV Budget 3000: Approximately 730 TPS
* KV Budget 3500: Approximately 680 TPS
* KV Budget 4000: Approximately 620 TPS
* KV Budget 4500: Approximately 570 TPS
* KV Budget 5000: Approximately 530 TPS
* Trend: The Throughput metric consistently decreases as the KV Budget increases, similar to the R1-Llama model. The line slopes downward.
### Key Observations
* **Trade-off:** Both models demonstrate a clear trade-off between Pass@1 and Throughput. Increasing the KV Budget generally improves accuracy (Pass@1) but reduces the number of transactions processed per second (Throughput).
* **Model Differences:** The R1-Qwen model exhibits a more consistent increase in Pass@1 with increasing KV Budget compared to the R1-Llama model, which shows an initial increase followed by a plateau and slight decrease.
* **Throughput Decline:** The decline in Throughput is more pronounced in the R1-Llama model than in the R1-Qwen model.
### Interpretation
The charts suggest that optimizing the KV Budget for these Large Language Models (LLMs) involves balancing accuracy and processing speed. A higher KV Budget allows for more complex computations, potentially leading to more accurate results (higher Pass@1), but at the cost of reduced throughput. The optimal KV Budget will depend on the specific application and its requirements.
The differences between the R1-Llama and R1-Qwen models indicate that they respond differently to changes in KV Budget. R1-Qwen appears to be more efficient in utilizing the increased computational resources to improve accuracy without a significant drop in throughput. This could be due to differences in model architecture, training data, or optimization techniques.
The consistent downward trend in Throughput for both models highlights a fundamental limitation: increasing model complexity (through higher KV Budget) often comes at the expense of processing speed. Further investigation could explore techniques to mitigate this trade-off, such as model quantization or pruning. The data suggests that the R1-Qwen model is more robust to this trade-off than the R1-Llama model.