## Bar Chart: R1-Llama vs R1-Qwen Performance Across KV Budgets
### Overview
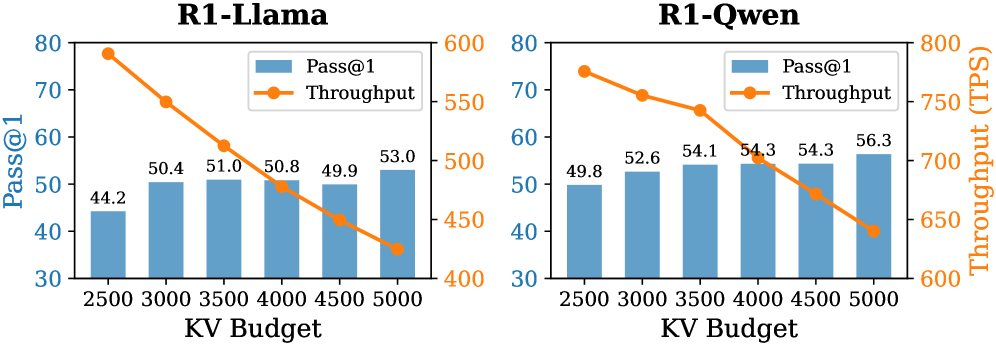
The image contains a dual-axis bar chart comparing the performance of two models (R1-Llama and R1-Qwen) across five KV Budget thresholds (2500–5000). Two metrics are measured: **Pass@1** (blue bars) and **Throughput (TPS)** (orange lines). The chart is split into two side-by-side panels, one for each model.
---
### Components/Axes
- **X-Axis**: KV Budget (2500, 3000, 3500, 4000, 4500, 5000)
- **Left Y-Axis (Pass@1)**: Scale 30–80 (percentage)
- **Right Y-Axis (Throughput)**: Scale 300–800 (TPS)
- **Legend**:
- Blue = Pass@1
- Orange = Throughput
- **Legend Position**: Top-right corner of the entire chart
- **Model Labels**:
- Left panel: R1-Llama
- Right panel: R1-Qwen
---
### Detailed Analysis
#### R1-Llama Panel
- **Pass@1 (Blue Bars)**:
- 2500 KV: 44.2
- 3000 KV: 50.4
- 3500 KV: 51.0
- 4000 KV: 50.8
- 4500 KV: 49.9
- 5000 KV: 53.0
- **Throughput (Orange Line)**:
- 2500 KV: 780
- 3000 KV: 720
- 3500 KV: 660
- 4000 KV: 550
- 4500 KV: 450
- 5000 KV: 400
#### R1-Qwen Panel
- **Pass@1 (Blue Bars)**:
- 2500 KV: 49.8
- 3000 KV: 52.6
- 3500 KV: 54.1
- 4000 KV: 54.3
- 4500 KV: 54.3
- 5000 KV: 56.3
- **Throughput (Orange Line)**:
- 2500 KV: 760
- 3000 KV: 700
- 3500 KV: 680
- 4000 KV: 650
- 4500 KV: 600
- 5000 KV: 600
---
### Key Observations
1. **Pass@1 Trends**:
- Both models show a **general upward trend** in Pass@1 as KV Budget increases, with minor fluctuations.
- R1-Qwen consistently outperforms R1-Llama across all KV Budgets (e.g., 56.3 vs. 53.0 at 5000 KV).
2. **Throughput Trends**:
- Both models exhibit a **steady decline** in Throughput as KV Budget increases.
- R1-Qwen maintains higher Throughput values than R1-Llama at equivalent KV Budgets (e.g., 600 vs. 400 TPS at 5000 KV).
3. **Trade-off Pattern**:
- Higher KV Budgets improve Pass@1 but reduce Throughput, suggesting a resource allocation trade-off.
- R1-Qwen demonstrates better efficiency, achieving higher Pass@1 with less throughput degradation.
---
### Interpretation
The data reveals a **performance-versus-efficiency trade-off** between the two models. R1-Qwen consistently achieves higher Pass@1 scores while maintaining superior Throughput across all KV Budgets, indicating it is more optimized for both accuracy and resource utilization. The decline in Throughput with increasing KV Budget suggests that larger budgets prioritize accuracy over computational speed. This pattern could reflect differences in model architecture, training data, or inference optimization strategies between the two models.