## Dual-Axis Line Chart: Token Length and Reproduced Rate over RL Training Steps
### Overview
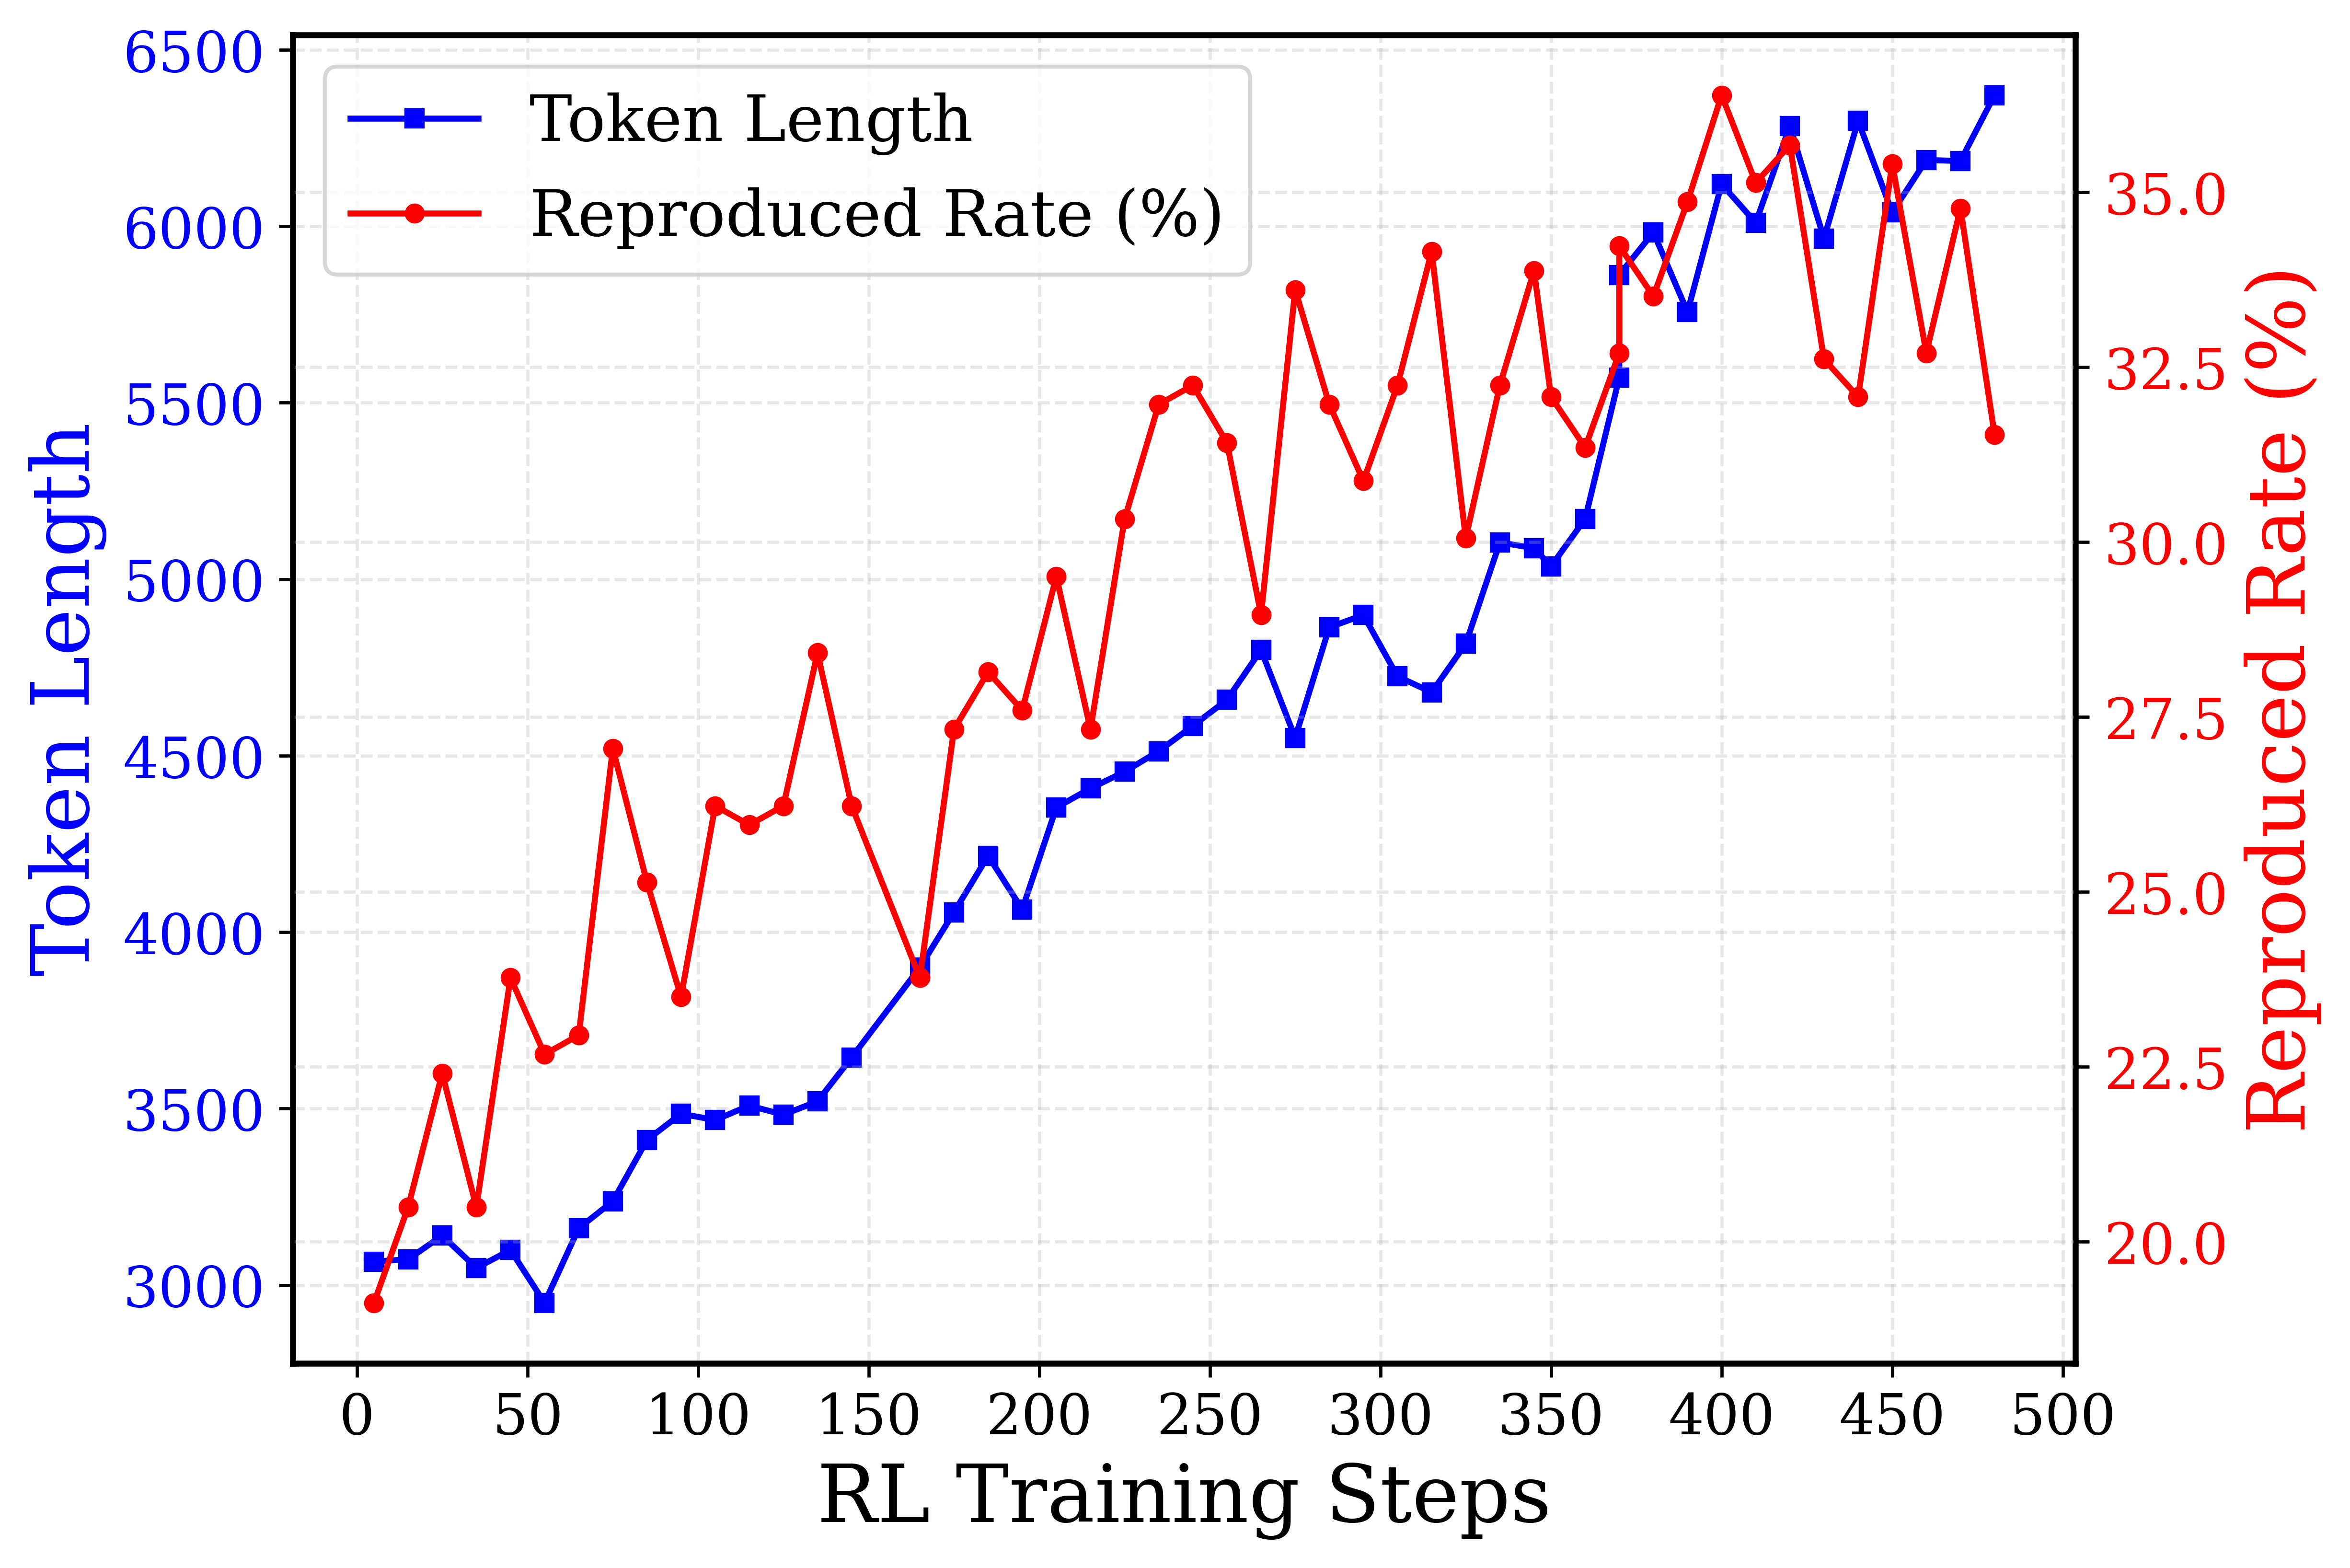
This image is a dual-axis line chart illustrating the progression of two metrics—"Token Length" and "Reproduced Rate (%)"—over a series of Reinforcement Learning (RL) Training Steps. The chart uses a blue line with square markers for the primary metric and a red line with circular markers for the secondary metric, plotted against a shared horizontal axis. A faint, dashed light-gray grid is visible in the background to aid in reading values.
### Components/Axes
**1. Legend (Spatial Grounding: Top-Left)**
* Located in the top-left corner of the chart area, enclosed in a white box with a rounded, light-gray border.
* **Item 1:** A blue horizontal line segment with a solid blue square in the center. Text label: "Token Length" (Black text).
* **Item 2:** A red horizontal line segment with a solid red circle in the center. Text label: "Reproduced Rate (%)" (Black text).
**2. X-Axis (Bottom)**
* **Position:** Bottom edge of the chart.
* **Label:** "RL Training Steps" (Black text, centered).
* **Scale:** Linear.
* **Markers/Ticks:** 0, 50, 100, 150, 200, 250, 300, 350, 400, 450, 500.
**3. Primary Y-Axis (Left)**
* **Position:** Left edge of the chart.
* **Label:** "Token Length" (Blue text, rotated 90 degrees counter-clockwise).
* **Scale:** Linear.
* **Markers/Ticks:** 3000, 3500, 4000, 4500, 5000, 5500, 6000, 6500.
* **Color Correlation:** The blue text and axis values correspond directly to the blue line (square markers) defined in the legend.
**4. Secondary Y-Axis (Right)**
* **Position:** Right edge of the chart.
* **Label:** "Reproduced Rate (%)" (Red text, rotated 90 degrees clockwise).
* **Scale:** Linear.
* **Markers/Ticks:** 20.0, 22.5, 25.0, 27.5, 30.0, 32.5, 35.0.
* **Color Correlation:** The red text and axis values correspond directly to the red line (circular markers) defined in the legend.
---
### Detailed Analysis
*Note: Data points are extracted via visual interpolation and represent approximate values (denoted by ~).*
#### Series 1: Token Length (Blue Line, Square Markers)
**Trend Verification:** The blue line exhibits a strong, relatively stable upward trend. It begins near the 3000 mark, remains somewhat flat with minor fluctuations until roughly step 150, and then climbs steadily, peaking near 6400 at the end of the training steps. The variance (noise) between individual steps is relatively low compared to the red line.
**Approximate Data Points (X: RL Step, Y: Token Length):**
* ~10: ~3050
* ~20: ~3050
* ~30: ~3150
* ~40: ~3050
* ~50: ~3100
* ~60: ~2950 (Local Minimum)
* ~70: ~3150
* ~80: ~3250
* ~90: ~3400
* ~100: ~3500
* ~110: ~3450
* ~120: ~3500
* ~130: ~3450
* ~140: ~3500
* ~150: ~3650
* ~165: ~3900
* ~175: ~4050
* ~185: ~4200
* ~195: ~4050
* ~205: ~4350
* ~215: ~4400
* ~225: ~4450
* ~235: ~4500
* ~245: ~4600
* ~255: ~4650
* ~265: ~4800
* ~275: ~4550
* ~285: ~4850
* ~295: ~4900
* ~305: ~4750
* ~315: ~4700
* ~325: ~4800
* ~335: ~5100
* ~345: ~5100
* ~355: ~5050
* ~365: ~5150
* ~375: ~5550
* ~380: ~5850
* ~390: ~6000
* ~400: ~5750
* ~410: ~6100
* ~420: ~6000
* ~430: ~6250
* ~440: ~5950
* ~450: ~6300
* ~460: ~6050
* ~470: ~6200
* ~480: ~6400 (Maximum)
#### Series 2: Reproduced Rate (%) (Red Line, Circular Markers)
**Trend Verification:** The red line shows a general upward trajectory over time but is characterized by extreme volatility. It starts just below 20.0%, experiences sharp, jagged peaks and valleys throughout the training process, and reaches its absolute peak near 37.5% around step 400. Even in the later stages of training, the metric swings wildly between ~30% and ~37%.
**Approximate Data Points (X: RL Step, Y: Reproduced Rate %):**
* ~10: ~19.5
* ~20: ~21.0
* ~30: ~23.0
* ~40: ~21.0
* ~50: ~24.5
* ~60: ~23.5
* ~70: ~23.8
* ~80: ~28.0 (Early Spike)
* ~90: ~26.0
* ~100: ~24.2
* ~110: ~27.0
* ~120: ~26.8
* ~130: ~27.0
* ~140: ~29.5
* ~150: ~27.0
* ~165: ~24.5
* ~175: ~28.2
* ~185: ~29.0
* ~195: ~28.5
* ~205: ~30.5
* ~215: ~28.2
* ~225: ~31.2
* ~235: ~33.0
* ~245: ~33.2
* ~255: ~32.5
* ~265: ~29.8
* ~275: ~34.5
* ~285: ~33.0
* ~295: ~31.8
* ~305: ~33.2
* ~315: ~35.0
* ~325: ~31.0
* ~335: ~33.2
* ~345: ~35.0
* ~355: ~33.0
* ~365: ~32.2
* ~375: ~35.2
* ~380: ~34.0
* ~390: ~36.0
* ~400: ~37.5 (Maximum)
* ~410: ~35.5
* ~420: ~36.5
* ~430: ~31.5 (Sharp Drop)
* ~440: ~31.0
* ~450: ~35.5
* ~460: ~31.5
* ~470: ~34.0
* ~480: ~30.5
---
### Key Observations
1. **Positive Correlation:** Both metrics generally increase as the RL Training Steps progress. As the model trains, it generates longer token sequences and achieves a higher reproduction rate.
2. **Divergent Volatility:** The "Token Length" (blue) grows in a relatively smooth, linear fashion after step 150. Conversely, the "Reproduced Rate" (red) is highly erratic, featuring massive step-to-step swings (e.g., dropping from ~36.5% to ~31.5% between steps 420 and 430).
3. **Late-Stage Behavior:** Between steps 350 and 500, the Token Length continues to push higher, breaking the 6000 mark. However, the Reproduced Rate appears to plateau in its upward trend, oscillating violently between 30% and 37% without establishing a higher baseline.
### Interpretation
This chart likely represents the training dynamics of a Large Language Model (LLM) or sequence-generation model undergoing Reinforcement Learning (such as RLHF - Reinforcement Learning from Human Feedback).
* **Token Length:** The steady increase in Token Length indicates that the reward model is likely incentivizing longer outputs. The model is learning to be more verbose or comprehensive as training progresses, effectively doubling its output length from ~3000 to ~6400 tokens.
* **Reproduced Rate (%):** This metric likely measures the model's ability to successfully reproduce a specific target behavior, format, or ground-truth sequence. The overall increase from ~20% to ~35% shows that learning is occurring.
* **Reading Between the Lines (The Volatility):** The extreme jaggedness of the red line is a classic hallmark of Reinforcement Learning policy updates. RL algorithms (like PPO) can be unstable; an update that improves the policy in one step might cause a regression in the next. The fact that Token Length grows smoothly while Reproduced Rate thrashes suggests a tension in the reward function. The model easily learns to generate *more* text (smooth blue line), but generating the *correct* text (red line) is a much harder, less stable optimization landscape. The late-stage plateau of the red line suggests the model may be reaching its capacity for this specific task, or that the learning rate needs decay to stabilize the final policy.