## Line Chart: Token Length vs. Reproduced Rate (%)
### Overview
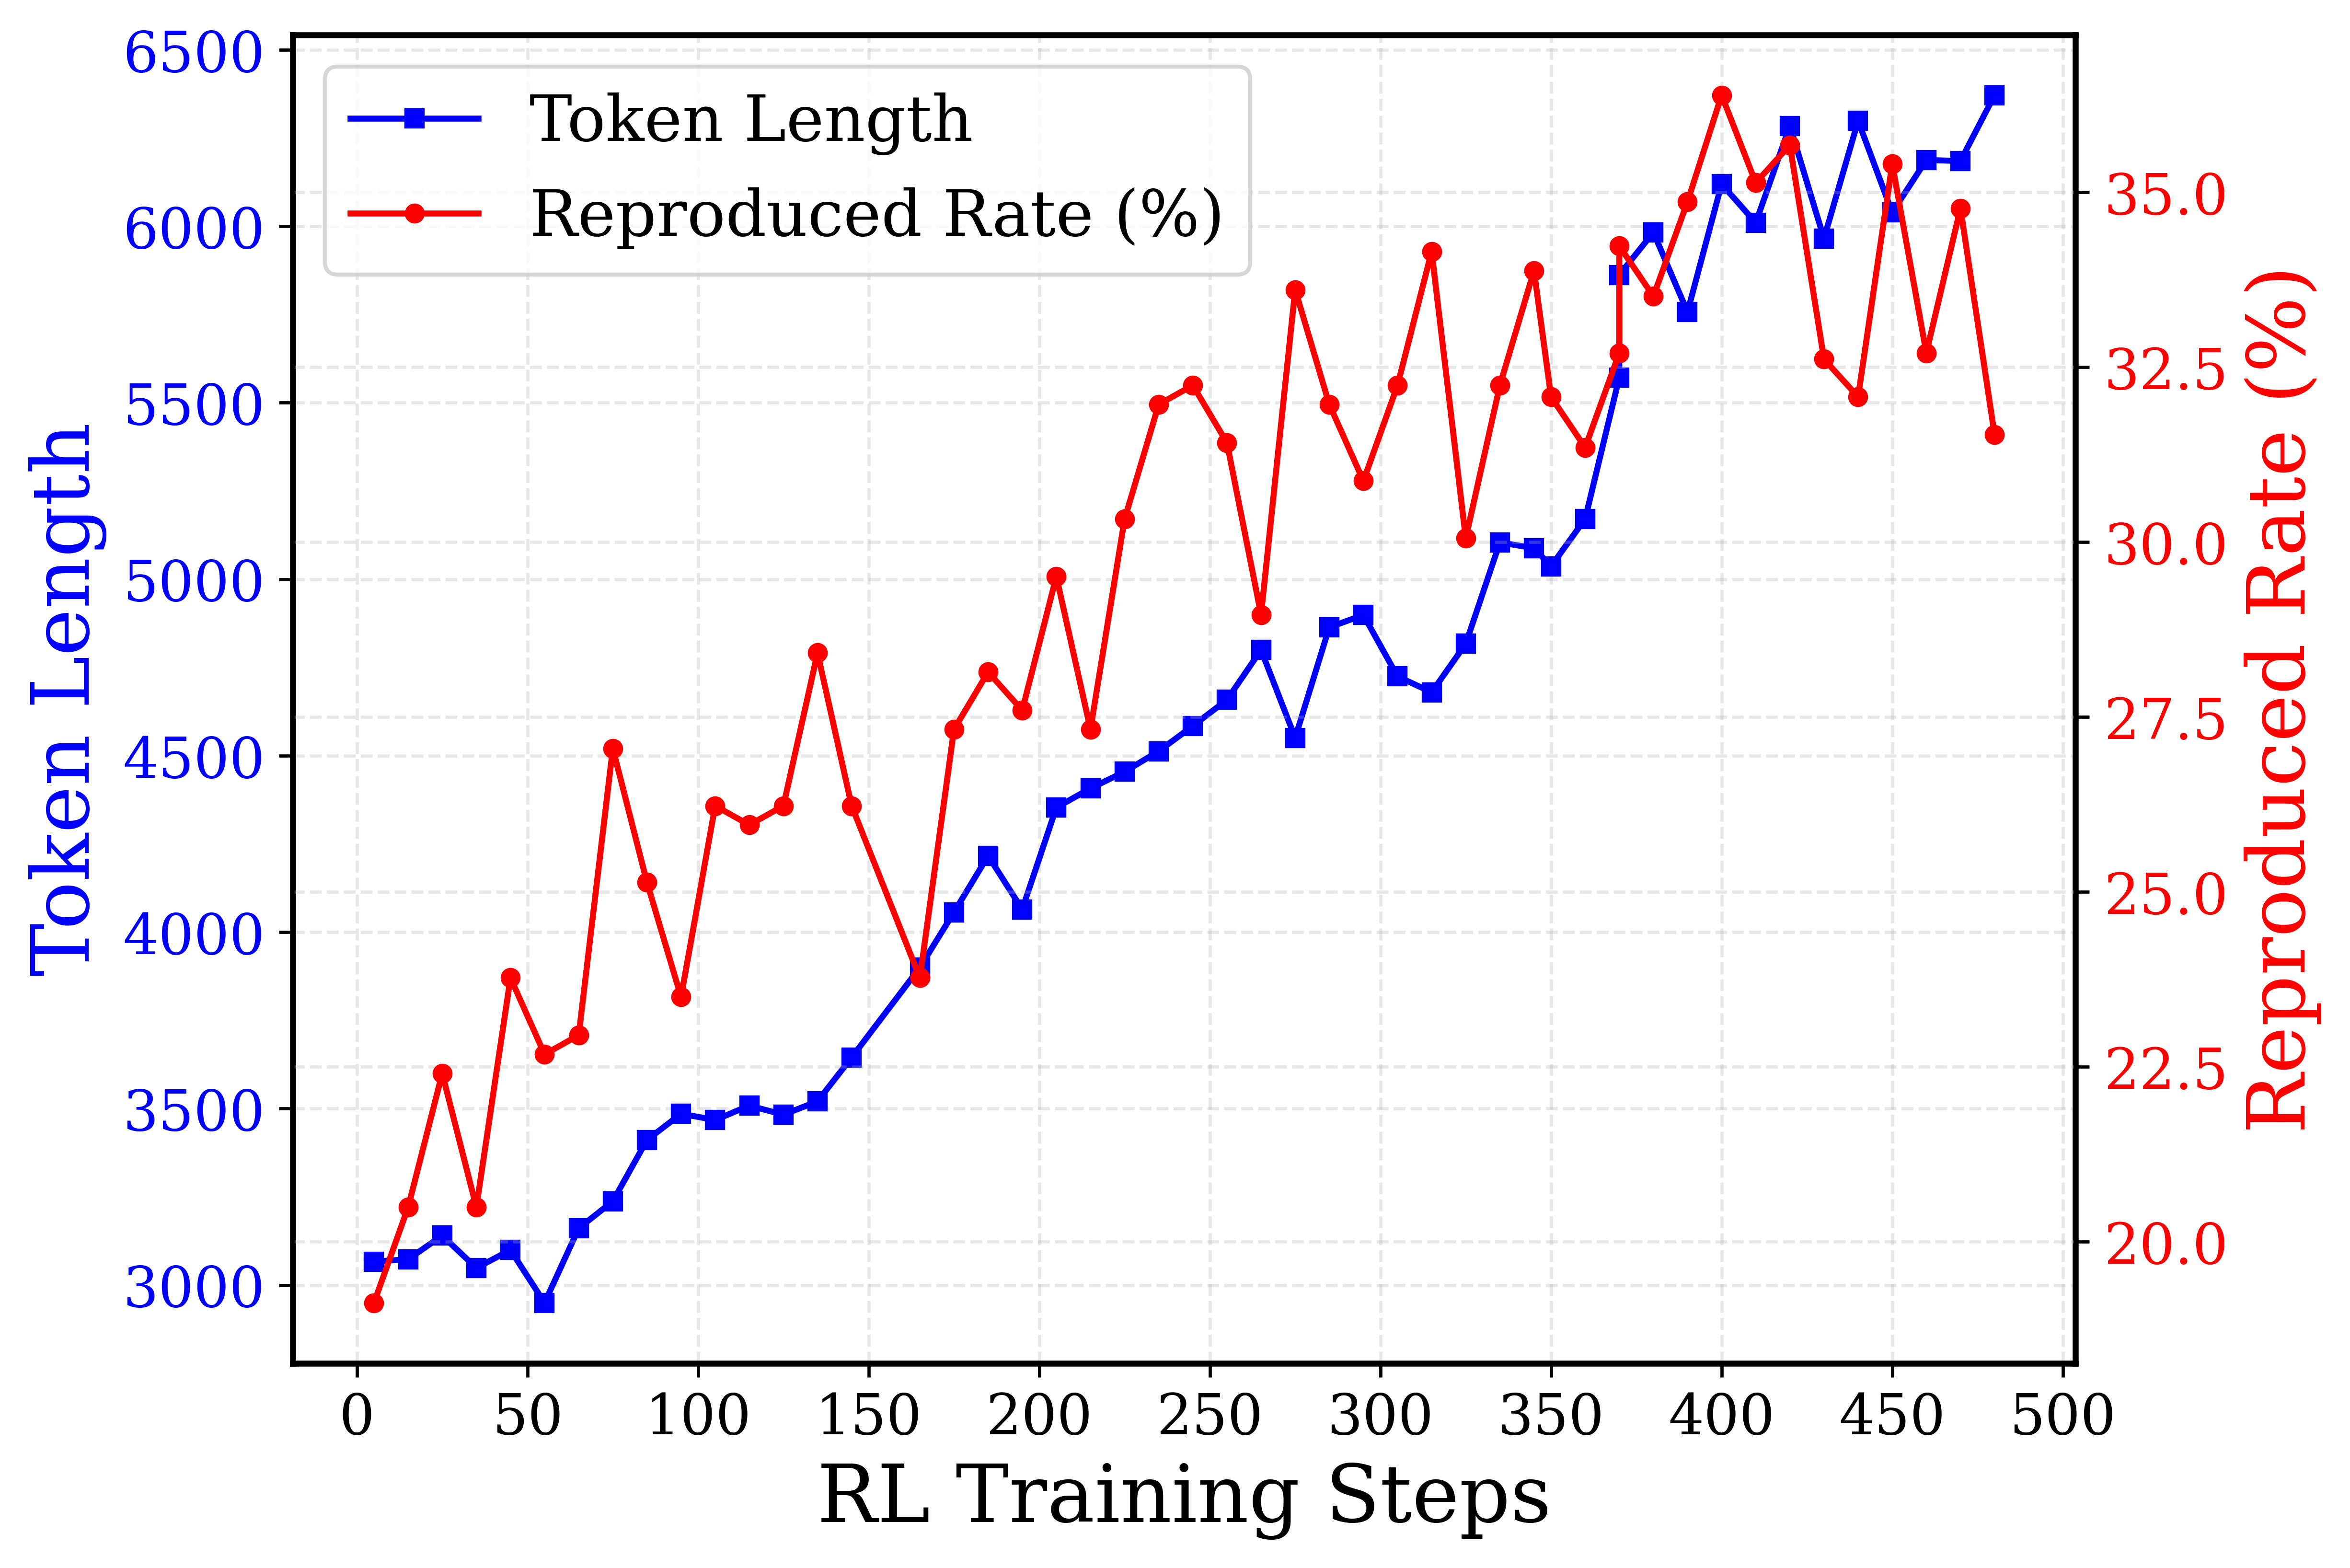
The image is a line chart comparing "Token Length" and "Reproduced Rate (%)" over "RL Training Steps". The chart displays two data series: Token Length (blue line with square markers) and Reproduced Rate (%) (red line with circular markers). The x-axis represents "RL Training Steps," while the left y-axis represents "Token Length," and the right y-axis represents "Reproduced Rate (%)".
### Components/Axes
* **X-axis:** "RL Training Steps" ranging from 0 to 500, with increments of 50.
* **Left Y-axis:** "Token Length" ranging from 3000 to 6500, with increments of 500.
* **Right Y-axis:** "Reproduced Rate (%)" ranging from 20.0 to 35.0, with increments of 2.5.
* **Legend (Top-Left):**
* Blue square marker: "Token Length"
* Red circle marker: "Reproduced Rate (%)"
### Detailed Analysis
* **Token Length (Blue):** The token length generally increases with RL Training Steps.
* At 0 steps, the token length is approximately 3050.
* At 100 steps, the token length is approximately 3500.
* At 200 steps, the token length is approximately 4300.
* At 300 steps, the token length is approximately 4700.
* At 400 steps, the token length is approximately 5900.
* At 500 steps, the token length is approximately 6400.
* **Reproduced Rate (%) (Red):** The reproduced rate fluctuates significantly but generally increases with RL Training Steps, especially up to around 400 steps, after which it becomes more volatile.
* At 0 steps, the reproduced rate is approximately 20%.
* At 100 steps, the reproduced rate is approximately 27%.
* At 200 steps, the reproduced rate is approximately 28%.
* At 300 steps, the reproduced rate is approximately 31%.
* At 400 steps, the reproduced rate is approximately 34%.
* At 500 steps, the reproduced rate is approximately 32%.
### Key Observations
* Both Token Length and Reproduced Rate generally increase with RL Training Steps.
* The Reproduced Rate exhibits more volatility than the Token Length.
* The increase in Token Length appears more consistent and linear compared to the Reproduced Rate.
* Around 400 RL Training Steps, the Reproduced Rate shows a peak, followed by fluctuations.
### Interpretation
The chart suggests that as the RL Training Steps increase, the Token Length and Reproduced Rate generally improve. The fluctuations in the Reproduced Rate indicate that the model's performance varies during training, possibly due to exploration and exploitation trade-offs. The consistent increase in Token Length suggests a steady learning process, while the Reproduced Rate's volatility might indicate sensitivity to specific training episodes or changes in the environment. The peak in Reproduced Rate around 400 steps, followed by fluctuations, could indicate a point where the model starts to overfit or requires further fine-tuning.