## Dual-Axis Line Chart: RL Training Progression
### Overview
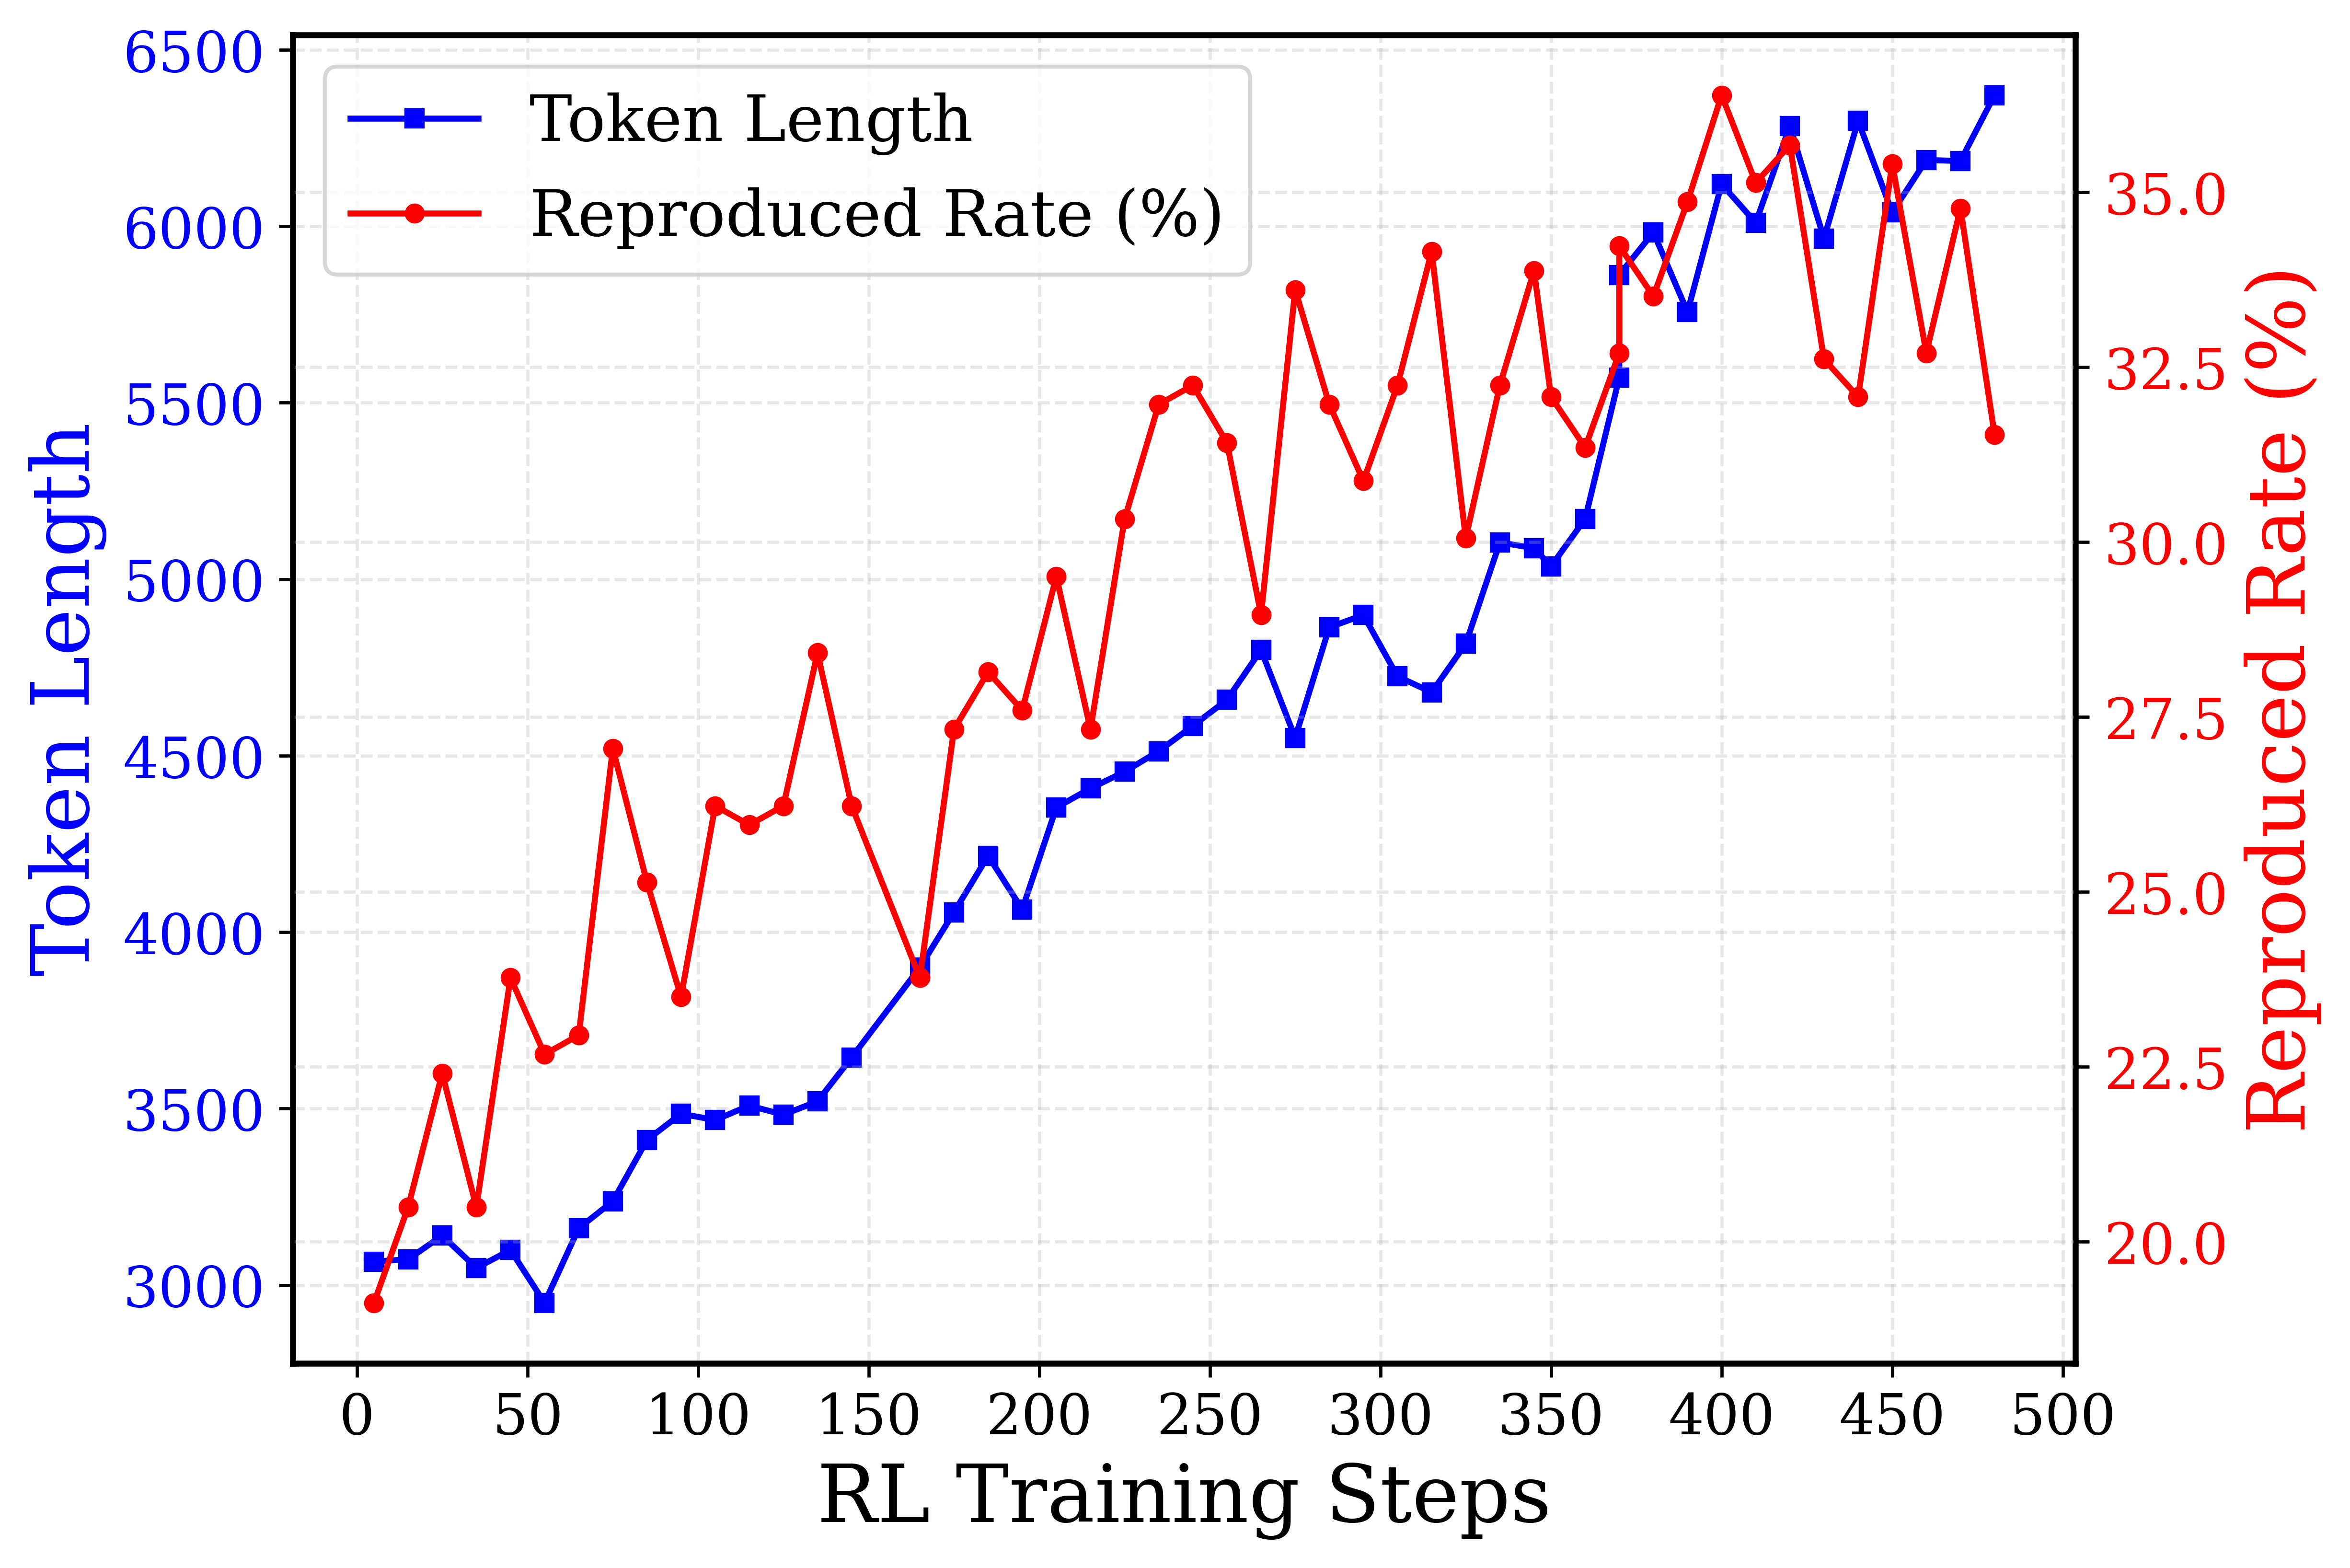
This is a dual-axis line chart plotting two metrics—**Token Length** and **Reproduced Rate (%)**—against **RL Training Steps**. The chart visualizes the progression of these two variables over the course of a reinforcement learning (RL) training process, spanning from step 0 to step 500. The data suggests a relationship between the length of generated tokens and the model's reproduction accuracy as training advances.
### Components/Axes
* **X-Axis (Bottom):** Labeled **"RL Training Steps"**. Linear scale from 0 to 500, with major tick marks every 50 steps.
* **Primary Y-Axis (Left):** Labeled **"Token Length"** in blue text. Linear scale from 3000 to 6500, with major tick marks every 500 units.
* **Secondary Y-Axis (Right):** Labeled **"Reproduced Rate (%)"** in red text. Linear scale from 20.0 to 35.0, with major tick marks every 2.5 percentage points.
* **Legend:** Located in the top-left corner of the plot area.
* Blue line with square markers: **"Token Length"**
* Red line with circle markers: **"Reproduced Rate (%)"**
* **Grid:** A light gray, dashed grid is present for both axes, aiding in value estimation.
### Detailed Analysis
**1. Token Length (Blue Line, Left Axis):**
* **Trend:** Shows a strong, generally consistent upward trend throughout training, with minor local fluctuations.
* **Key Data Points (Approximate):**
* Step 0: ~3050
* Step 50: ~3000 (local minimum)
* Step 100: ~3500
* Step 150: ~3650
* Step 200: ~4050
* Step 250: ~4600
* Step 300: ~4900
* Step 350: ~5100
* Step 400: ~6100
* Step 450: ~6200
* Step 500: ~6400 (peak)
* **Observation:** The growth is relatively smooth from step 150 onward, with a notable acceleration between steps 350 and 400.
**2. Reproduced Rate (%) (Red Line, Right Axis):**
* **Trend:** Exhibits a volatile but overall upward trend, characterized by sharp peaks and troughs.
* **Key Data Points (Approximate):**
* Step 0: ~20.0% (minimum)
* Step 50: ~22.5%
* Step 100: ~27.5% (local peak)
* Step 150: ~27.5%
* Step 200: ~27.5%
* Step 250: ~32.5% (local peak)
* Step 300: ~32.5%
* Step 350: ~32.5%
* Step 400: ~35.0% (global peak)
* Step 450: ~32.5%
* Step 500: ~32.0%
* **Observation:** The rate is highly unstable. Major dips occur around steps 75, 175, 275, and 425. The highest reproduction rate (~35%) is achieved near step 400, coinciding with a steep rise in token length.
### Key Observations
1. **Correlation with Volatility:** While both metrics trend upward, the **Reproduced Rate** is far more volatile than the steadily increasing **Token Length**. This suggests that while the model learns to generate longer sequences, its ability to accurately reproduce target content is less stable and may be sensitive to specific training phases.
2. **Peak Performance Window:** The highest reproduction rate (~35%) occurs in the step 380-420 window, where token length is also rapidly increasing (from ~5500 to ~6100). This could indicate an optimal training phase.
3. **Late-Stage Divergence:** After step 400, token length continues to climb to its maximum (~6400), but the reproduced rate declines from its peak and becomes erratic. This divergence might signal the onset of overfitting, where the model generates longer but less accurate outputs.
4. **Initial Phase:** The first 50 steps show minimal growth in token length and a low, fluctuating reproduction rate, typical of early training exploration.
### Interpretation
The chart demonstrates a common dynamic in RL training for generative models: **increased output complexity (longer tokens) does not guarantee improved performance (higher reproduction rate)**. The data suggests:
* **Learning Progress:** The model successfully learns to generate longer sequences as training progresses, indicating it is capturing more complex patterns or adhering to longer-form generation objectives.
* **Performance Instability:** The high volatility in the reproduction rate implies the training process is unstable. The model's accuracy is not improving monotonically; it experiences significant setbacks, which could be due to factors like reward function sparsity, policy updates causing catastrophic forgetting, or exploration-exploitation trade-offs.
* **Potential Overfitting or Objective Misalignment:** The final phase (steps 400-500) is critical. The continued increase in token length coupled with a declining and unstable reproduction rate suggests the model may be optimizing for length at the expense of accuracy, or that the training objective is not perfectly aligned with the desired outcome of faithful reproduction.
* **Actionable Insight:** A practitioner analyzing this chart might consider adjusting the training hyperparameters (e.g., learning rate, reward scaling) after step 400 to stabilize the reproduced rate, or investigate why performance peaks and then degrades despite longer generations. The optimal checkpoint for deployment might be around step 400, where reproduction rate is maximized.