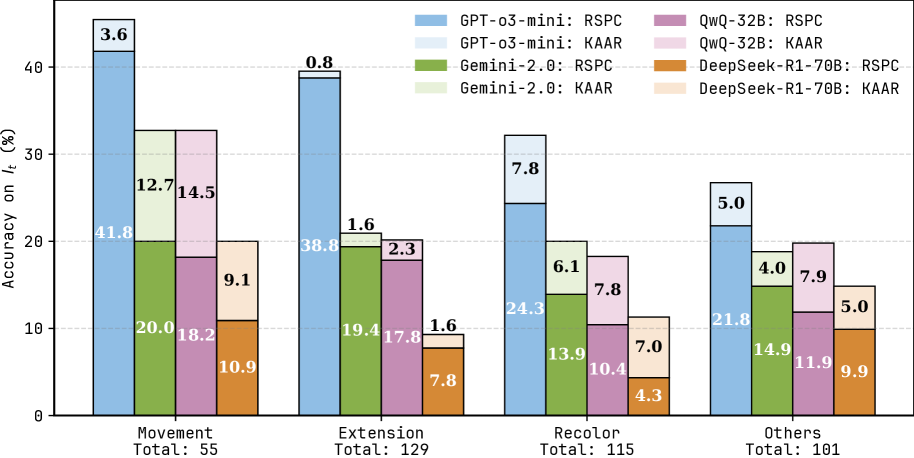
## Grouped Bar Chart: AI Model Accuracy on RSPC and KAAR Metrics by Task Category
### Overview
This image is a grouped bar chart comparing the performance of four different AI models across four task categories. Performance is measured by accuracy percentage on two distinct metrics: RSPC and KAAR. The chart displays the accuracy for each model-metric combination within each task category, with the total number of samples for each category noted below the category label.
### Components/Axes
* **Chart Type:** Grouped Bar Chart.
* **Y-Axis:** Labeled "Accuracy on $I_t$ (%)". The scale runs from 0 to 40, with major gridlines at intervals of 10.
* **X-Axis:** Four categorical task groups:
1. Movement (Total: 55)
2. Extension (Total: 129)
3. Recolor (Total: 115)
4. Others (Total: 101)
* **Legend:** Located in the top-right corner. It defines eight data series, pairing four models with two metrics each. The color coding is as follows:
* **GPT-o3-mini: RSPC** - Solid medium blue.
* **GPT-o3-mini: KAAR** - Light blue (top segment of the blue bar).
* **Gemini-2.0: RSPC** - Solid olive green.
* **Gemini-2.0: KAAR** - Light green (top segment of the green bar).
* **QwQ-32B: RSPC** - Solid purple.
* **QwQ-32B: KAAR** - Light purple (top segment of the purple bar).
* **DeepSeek-R1-70B: RSPC** - Solid orange.
* **DeepSeek-R1-70B: KAAR** - Light orange/peach (top segment of the orange bar).
* **Bar Structure:** For each model within a category, the bar is stacked. The lower, solid-colored segment represents the RSPC accuracy. The upper, lighter-colored segment represents the KAAR accuracy. The numerical value for each segment is printed directly on it.
### Detailed Analysis
**1. Movement (Total: 55 samples)**
* **GPT-o3-mini:** RSPC = 41.8%, KAAR = 3.6%. Total height ~45.4%.
* **Gemini-2.0:** RSPC = 20.0%, KAAR = 12.7%. Total height = 32.7%.
* **QwQ-32B:** RSPC = 18.2%, KAAR = 14.5%. Total height = 32.7%.
* **DeepSeek-R1-70B:** RSPC = 10.9%, KAAR = 9.1%. Total height = 20.0%.
**2. Extension (Total: 129 samples)**
* **GPT-o3-mini:** RSPC = 38.0%, KAAR = 0.8%. Total height = 38.8%.
* **Gemini-2.0:** RSPC = 19.4%, KAAR = 1.6%. Total height = 21.0%.
* **QwQ-32B:** RSPC = 17.8%, KAAR = 2.3%. Total height = 20.1%.
* **DeepSeek-R1-70B:** RSPC = 7.8%, KAAR = 1.6%. Total height = 9.4%.
**3. Recolor (Total: 115 samples)**
* **GPT-o3-mini:** RSPC = 24.3%, KAAR = 7.8%. Total height = 32.1%.
* **Gemini-2.0:** RSPC = 13.9%, KAAR = 6.1%. Total height = 20.0%.
* **QwQ-32B:** RSPC = 10.4%, KAAR = 7.8%. Total height = 18.2%.
* **DeepSeek-R1-70B:** RSPC = 4.3%, KAAR = 7.0%. Total height = 11.3%.
**4. Others (Total: 101 samples)**
* **GPT-o3-mini:** RSPC = 21.8%, KAAR = 5.0%. Total height = 26.8%.
* **Gemini-2.0:** RSPC = 14.9%, KAAR = 4.0%. Total height = 18.9%.
* **QwQ-32B:** RSPC = 11.9%, KAAR = 7.9%. Total height = 19.8%.
* **DeepSeek-R1-70B:** RSPC = 9.9%, KAAR = 5.0%. Total height = 14.9%.
### Key Observations
1. **Model Performance Hierarchy:** GPT-o3-mini consistently achieves the highest accuracy on the RSPC metric across all four task categories. Its lead is most pronounced in "Movement" (41.8% vs. next best 20.0%) and "Extension" (38.0% vs. 19.4%).
2. **Metric Disparity (RSPC vs. KAAR):** For every model and every task category, the RSPC accuracy is significantly higher than the KAAR accuracy. The KAAR scores are generally low, often in single digits, with the highest being 14.5% (QwQ-32B on Movement).
3. **Task Difficulty:** The "Movement" category appears to be the easiest for the models, yielding the highest overall accuracy scores. "Extension" and "Recolor" show moderate performance, while "Others" generally has lower scores, suggesting it may be a more heterogeneous or difficult category.
4. **Model Comparison:** Gemini-2.0 and QwQ-32B perform similarly to each other, often within a few percentage points. DeepSeek-R1-70B consistently shows the lowest accuracy on the RSPC metric across all categories.
5. **KAAR Anomaly:** In the "Recolor" category, DeepSeek-R1-70B's KAAR accuracy (7.0%) is higher than its RSPC accuracy (4.3%), which is the only instance in the chart where the KAAR segment is larger than the RSPC segment for a given model.
### Interpretation
The data suggests a clear performance gap between the evaluated models on the RSPC metric, with GPT-o3-mini demonstrating a substantial advantage. The consistently low KAAR scores across all models indicate that this metric represents a much more challenging task or evaluation criterion than RSPC. The fact that RSPC accuracy is always higher implies that the skills or knowledge measured by RSPC are more readily accessible to these large language models than those measured by KAAR.
The variation across task categories ("Movement", "Extension", etc.) shows that model capability is not uniform; performance is task-dependent. The "Movement" task seems to be the most solvable for current models, while the "Others" category, likely a catch-all for miscellaneous tasks, proves more difficult. The anomaly in the "Recolor" category for DeepSeek-R1-70B, where KAAR outperforms RSPC, could indicate a specific strength in that model for the type of reasoning required by KAAR in that context, or it could be a statistical artifact due to the sample size (Total: 115). This chart effectively highlights both the relative strengths of the models and the significant challenge that the KAAR evaluation presents.