## Histogram: OmegaPRM Per-step Length Distribution
### Overview
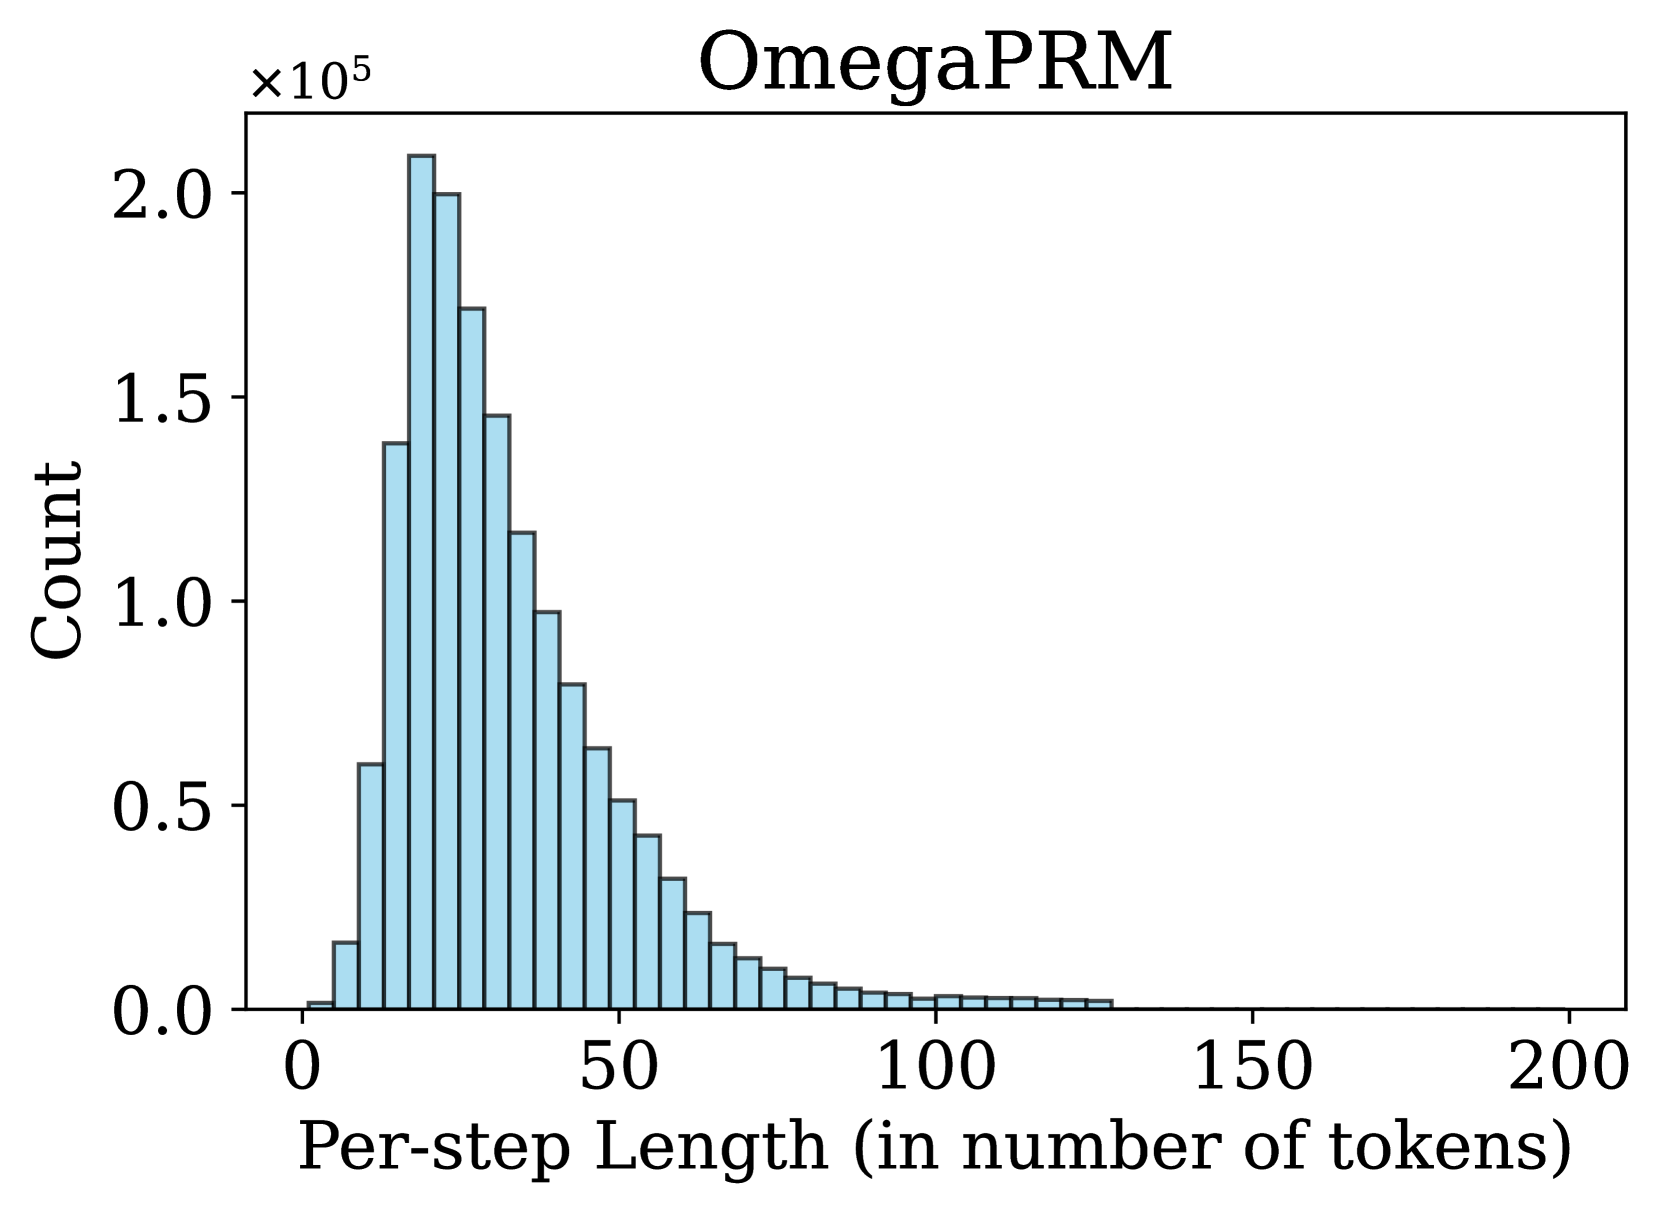
The image is a histogram displaying the distribution of "Per-step Length (in number of tokens)" for a process labeled "OmegaPRM". The x-axis represents the per-step length, and the y-axis represents the count, scaled by 10^5. The histogram shows a right-skewed distribution, with the highest frequency of per-step lengths occurring at lower values.
### Components/Axes
* **Title:** OmegaPRM
* **X-axis:**
* Label: Per-step Length (in number of tokens)
* Scale: 0 to 200, with major ticks at 0, 50, 100, 150, and 200.
* **Y-axis:**
* Label: Count
* Scale: 0.0 to 2.0, scaled by x10^5, with major ticks at 0.0, 0.5, 1.0, 1.5, and 2.0.
* **Bars:** The histogram bars are light blue with dark gray outlines.
### Detailed Analysis
The histogram bars represent the frequency of each per-step length. The distribution is heavily skewed to the right, indicating that shorter per-step lengths are much more common than longer ones.
* **Peak:** The highest bar appears to be around a per-step length of approximately 20 tokens, with a count of approximately 2.1 x 10^5.
* **Decline:** The count decreases rapidly as the per-step length increases from 20 to 50 tokens.
* **Tail:** The distribution has a long tail extending to the right, indicating that while less frequent, per-step lengths can reach up to 200 tokens.
* **Specific Values (Approximate):**
* Per-step length = 0: Count ≈ 0.01 x 10^5
* Per-step length = 20: Count ≈ 2.1 x 10^5
* Per-step length = 50: Count ≈ 0.2 x 10^5
* Per-step length = 100: Count ≈ 0.02 x 10^5
* Per-step length = 150: Count ≈ 0.005 x 10^5
* Per-step length = 200: Count ≈ 0.001 x 10^5
### Key Observations
* The distribution is strongly right-skewed.
* The majority of per-step lengths are relatively short.
* There is a significant drop in count as the per-step length increases.
* The tail of the distribution extends to higher per-step lengths, indicating the presence of some longer steps.
### Interpretation
The histogram suggests that the OmegaPRM process typically involves short steps, as indicated by the high frequency of low per-step lengths. The right skew indicates that while short steps are the norm, longer steps do occur, albeit much less frequently. This could be due to the nature of the process, where most steps are simple and direct, but occasionally, more complex or circuitous steps are required. The data implies that the OmegaPRM process is optimized for efficiency, favoring shorter steps whenever possible.