\n
## Histogram: OmegaPRM Per-step Length Distribution
### Overview
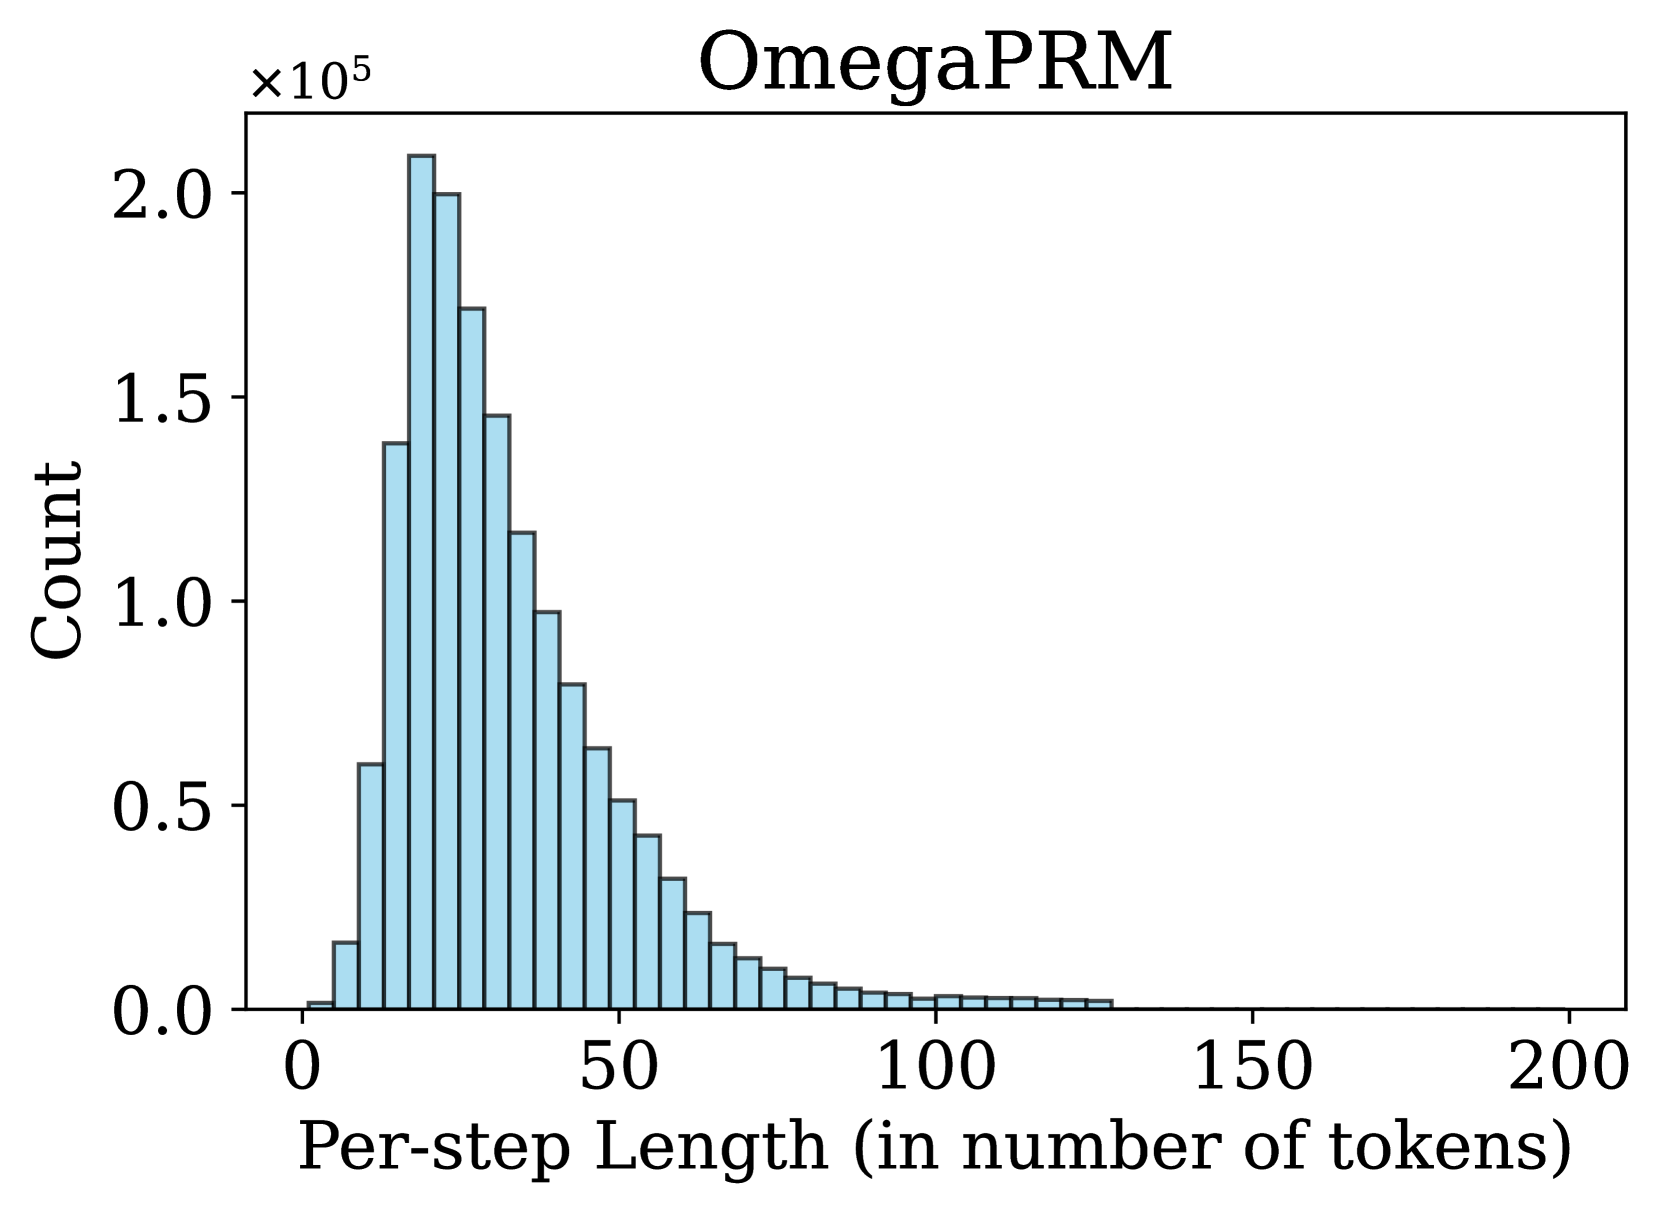
The image presents a histogram visualizing the distribution of "Per-step Length" measured in "number of tokens" for a system or process labeled "OmegaPRM". The histogram displays the frequency (Count) of different per-step lengths.
### Components/Axes
* **Title:** OmegaPRM (positioned at the top-center)
* **X-axis Label:** Per-step Length (in number of tokens) (positioned at the bottom-center)
* **Y-axis Label:** Count (positioned at the left-center)
* **Y-axis Scale:** The Y-axis is scaled to multiples of 10<sup>5</sup>. The scale ranges from 0 to 2.0 x 10<sup>5</sup>.
* **X-axis Scale:** The X-axis ranges from 0 to 200, with increments of approximately 10.
### Detailed Analysis
The histogram consists of a series of bars representing the frequency of different per-step lengths. The distribution is heavily skewed to the right.
* **Trend:** The histogram shows a strong negative correlation between Per-step Length and Count. The frequency of shorter per-step lengths is significantly higher than that of longer lengths. The distribution peaks around a Per-step Length of approximately 10-20 tokens.
* **Data Points (Approximate):**
* Per-step Length = 0: Count ≈ 1.8 x 10<sup>5</sup>
* Per-step Length = 10: Count ≈ 1.7 x 10<sup>5</sup>
* Per-step Length = 20: Count ≈ 1.4 x 10<sup>5</sup>
* Per-step Length = 30: Count ≈ 0.9 x 10<sup>5</sup>
* Per-step Length = 40: Count ≈ 0.6 x 10<sup>5</sup>
* Per-step Length = 50: Count ≈ 0.4 x 10<sup>5</sup>
* Per-step Length = 60: Count ≈ 0.25 x 10<sup>5</sup>
* Per-step Length = 70: Count ≈ 0.15 x 10<sup>5</sup>
* Per-step Length = 80: Count ≈ 0.08 x 10<sup>5</sup>
* Per-step Length = 90: Count ≈ 0.04 x 10<sup>5</sup>
* Per-step Length = 100: Count ≈ 0.02 x 10<sup>5</sup>
* Per-step Length = 150: Count ≈ 0.005 x 10<sup>5</sup>
* Per-step Length = 200: Count ≈ 0.001 x 10<sup>5</sup>
### Key Observations
* The vast majority of per-step lengths are below 50 tokens.
* The distribution exhibits a long tail, indicating that while rare, there are some instances of significantly longer per-step lengths.
* The histogram is unimodal, with a single clear peak.
### Interpretation
The data suggests that the "OmegaPRM" system generally operates with relatively short per-step lengths, most frequently between 0 and 50 tokens. The right skew indicates that occasionally, the system processes steps with much longer token lengths, but these are infrequent. This distribution could be indicative of the nature of the tasks being processed by OmegaPRM. For example, it might suggest that most tasks are simple and require few tokens, while a smaller number of tasks are more complex and require a larger number of tokens. The shape of the distribution could also be influenced by the specific tokenization method used. Further investigation would be needed to understand the underlying reasons for this distribution and its implications for the performance and efficiency of the OmegaPRM system.