## Histogram: OmegaPRM Per-step Token Length Distribution
### Overview
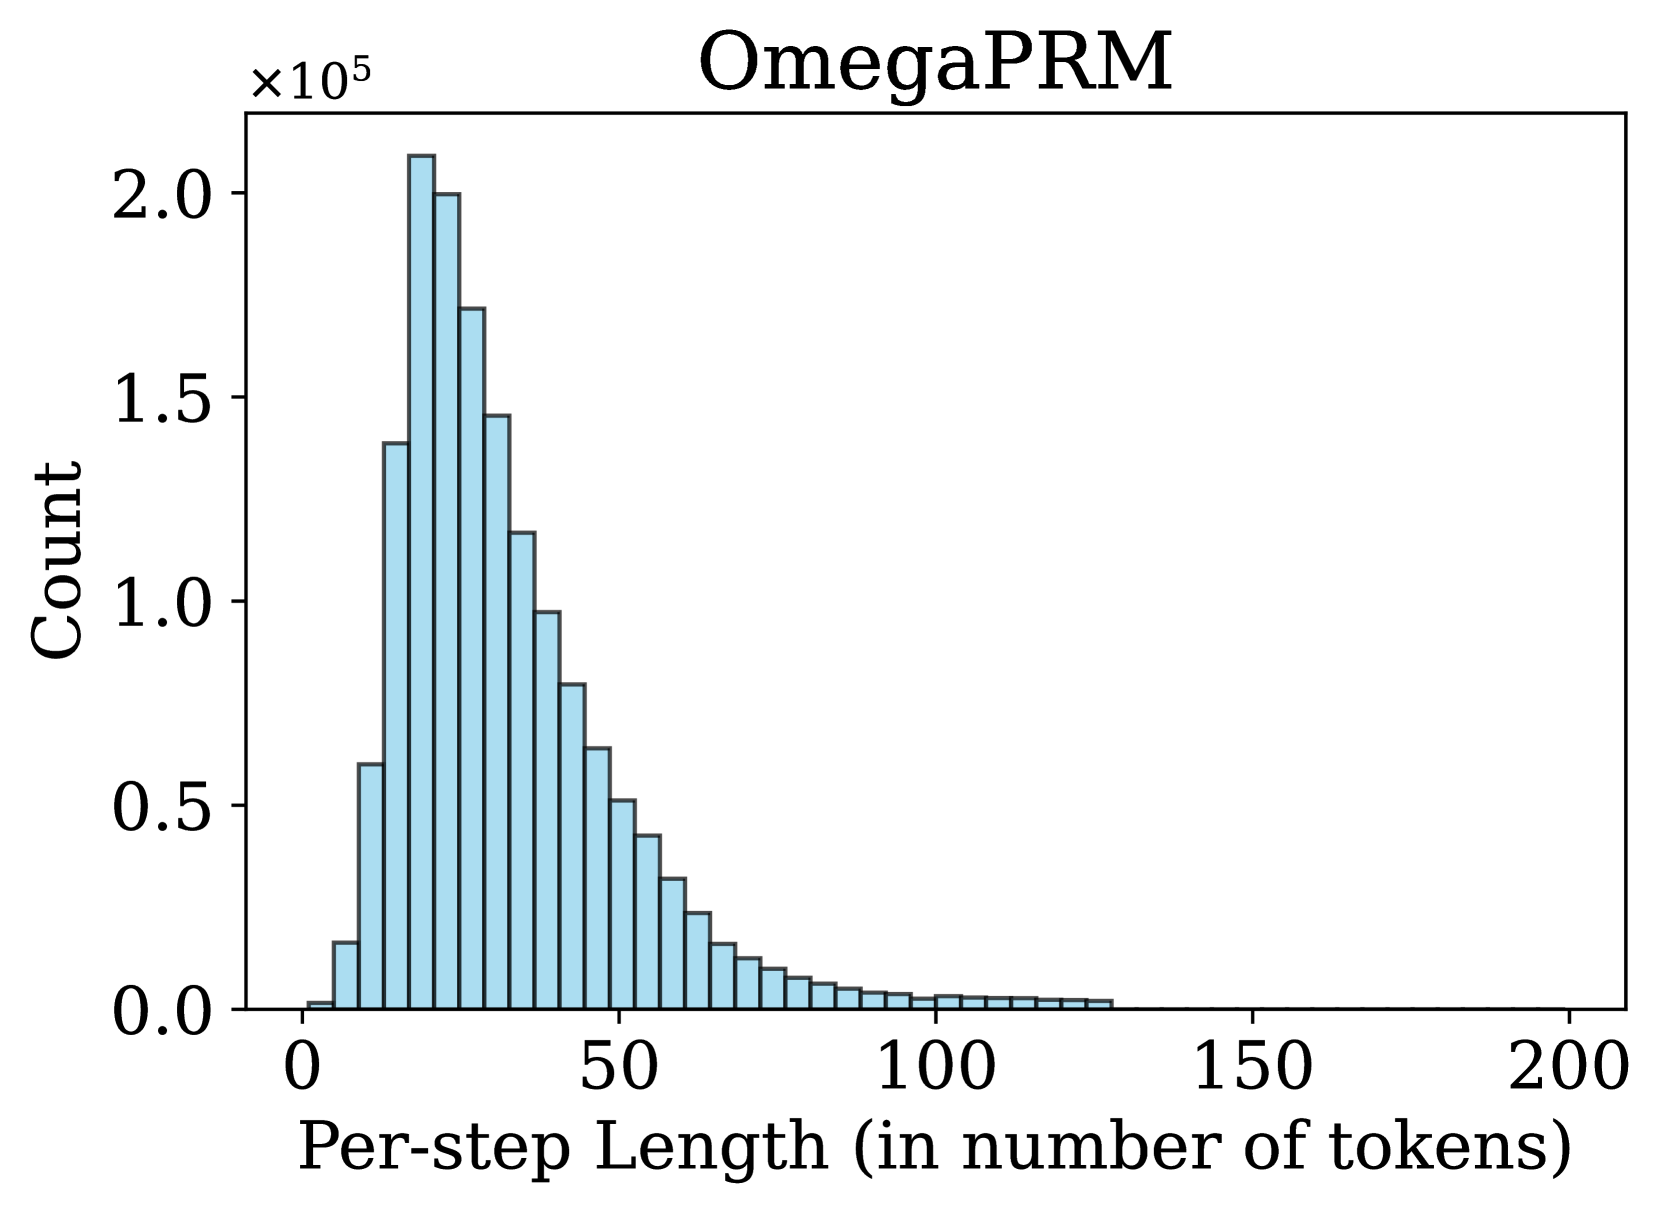
The image is a histogram titled "OmegaPRM" that visualizes the frequency distribution of per-step lengths, measured in the number of tokens. The chart displays a single data series represented by light blue bars, showing how many times (count) steps of various token lengths occur within the OmegaPRM dataset or process.
### Components/Axes
* **Title:** "OmegaPRM" (Top center).
* **Y-axis:** Labeled "Count". The scale is linear and includes a multiplier notation "×10⁵" at the top-left of the axis. Major tick marks are at 0.0, 0.5, 1.0, 1.5, and 2.0, representing counts from 0 to 200,000.
* **X-axis:** Labeled "Per-step Length (in number of tokens)". The scale is linear with major tick marks at 0, 50, 100, 150, and 200.
* **Data Series:** A single series of adjacent, light blue bars with black outlines. There is no legend, as only one category is plotted.
### Detailed Analysis
The histogram shows a **right-skewed (positively skewed) distribution**. The trend is a sharp rise to a peak followed by a long, gradual tail extending to the right.
* **Peak (Mode):** The highest frequency occurs for per-step lengths in the approximate range of **20-25 tokens**. The bar at this peak reaches a count of approximately **2.1 x 10⁵ (210,000)**.
* **Distribution Shape:**
* The count rises steeply from near zero at 0 tokens to the peak.
* After the peak, the count decreases steadily. By a length of 50 tokens, the count has fallen to roughly **0.6 x 10⁵ (60,000)**.
* The decline continues, becoming more gradual. At 100 tokens, the count is very low, approximately **0.05 x 10⁵ (5,000)** or less.
* The visible data tail ends around **125-130 tokens**, with counts approaching zero. The x-axis extends to 200, but no significant data is present beyond ~130.
* **Range:** The vast majority of per-step lengths fall between **~5 and ~100 tokens**. Steps shorter than 5 tokens or longer than 100 tokens are comparatively rare.
### Key Observations
1. **Strong Right Skew:** The distribution is not symmetric. The mean per-step length is likely greater than the median, which is greater than the mode (~22 tokens), due to the long tail of longer steps.
2. **Concentrated Mass:** The highest density of data is concentrated in a relatively narrow band between approximately 10 and 40 tokens.
3. **Absence of Very Long Steps:** There is no visible data for steps approaching 200 tokens, suggesting an upper bound or extreme rarity for steps of that length in this dataset.
### Interpretation
This histogram characterizes the "Per-step Length" for a system or dataset named "OmegaPRM." The data suggests that the process generating these steps most commonly produces outputs of moderate length (around 20-25 tokens). The right-skewed nature indicates that while short-to-moderate steps are the norm, there is a significant, diminishing probability of encountering progressively longer steps.
In a technical context, this could represent:
* The length of individual reasoning steps in a chain-of-thought process.
* The size of data chunks processed in an iterative algorithm.
* The length of generated text segments in a language model task.
The distribution implies that the system is optimized for or naturally tends toward concise steps, but retains the capacity for longer, more complex steps when necessary, albeit with decreasing frequency. The lack of steps near 200 tokens may indicate a practical or imposed limit on step length.