## Histogram: OmegaPRM Per-step Length Distribution
### Overview
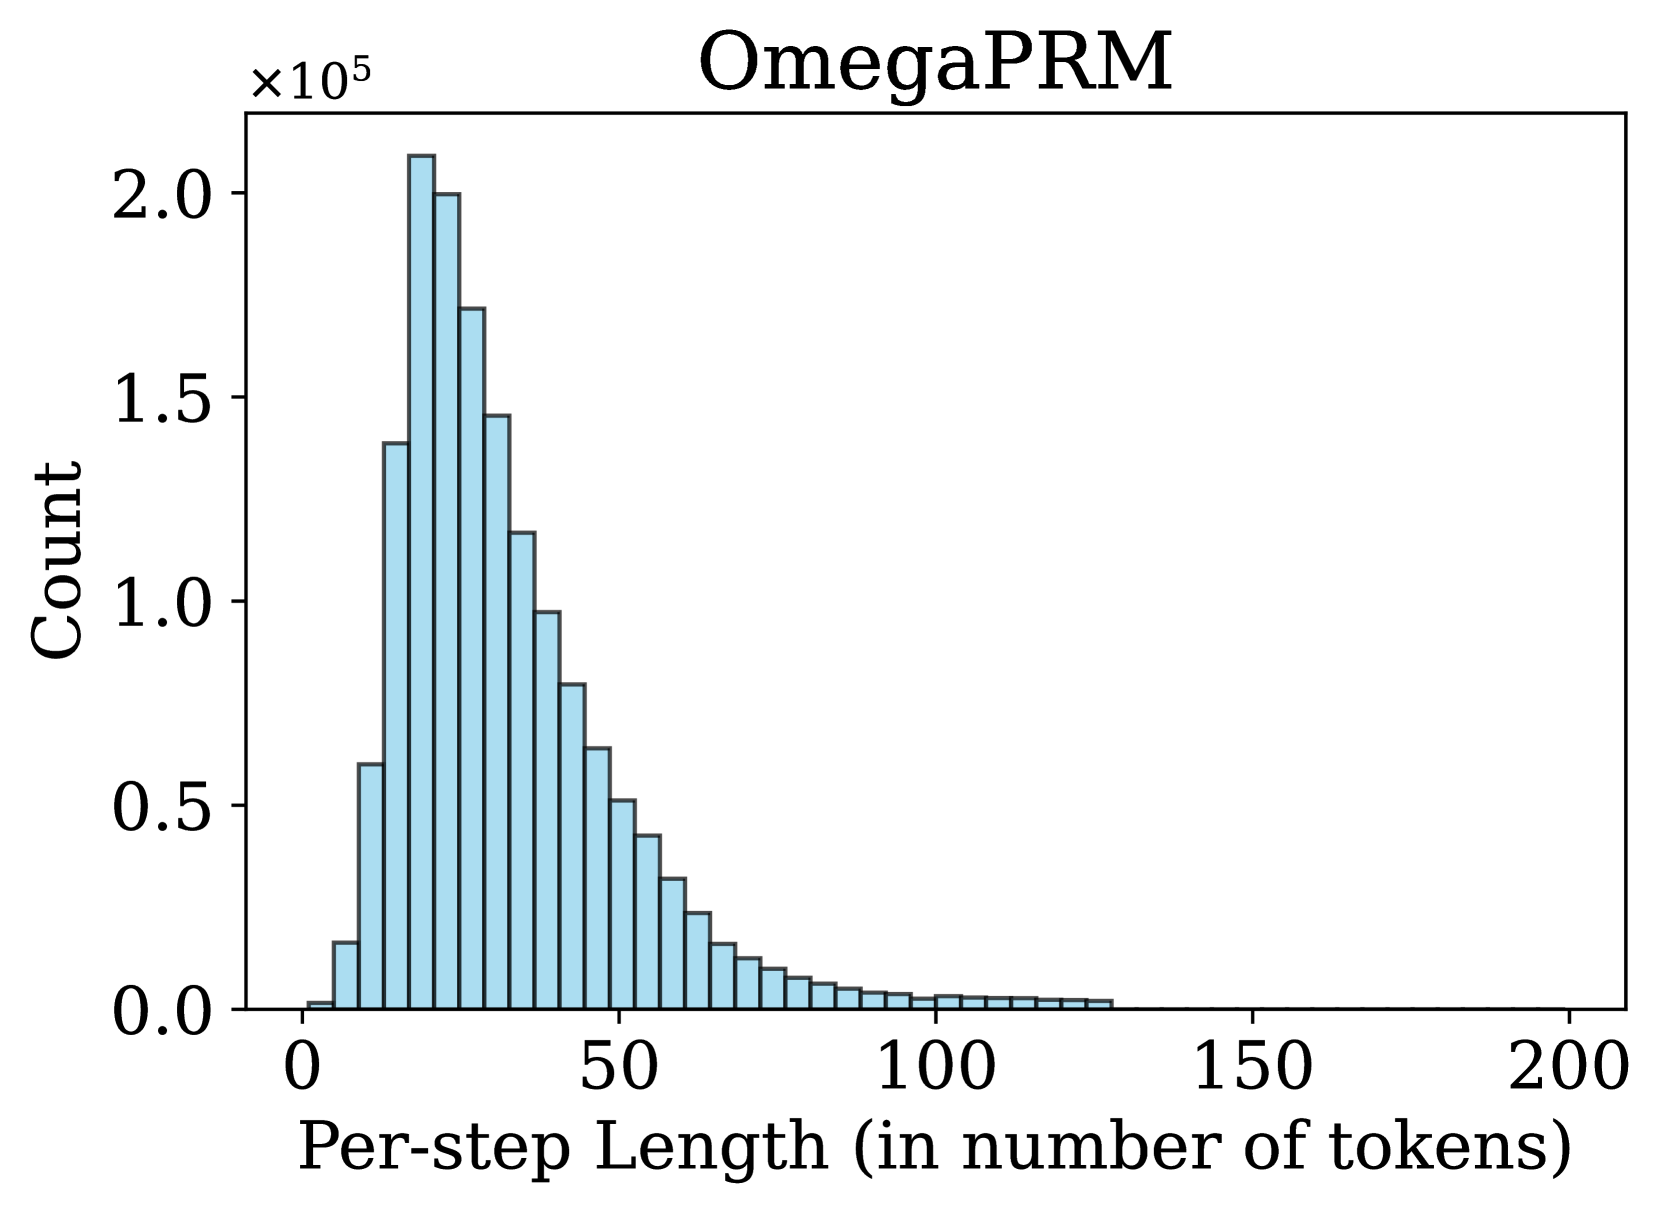
The image displays a histogram titled "OmegaPRM" showing the distribution of per-step lengths (in number of tokens) for a dataset or model. The y-axis represents counts scaled by 10⁵, while the x-axis measures per-step length in tokens. The distribution is heavily skewed, with a sharp decline in frequency as per-step length increases.
### Components/Axes
- **Title**: "OmegaPRM" (top center)
- **Y-axis**:
- Label: "Count"
- Scale: 0 to 2.0×10⁵ (increments of 0.5×10⁵)
- Units: Absolute counts (no explicit units beyond "Count")
- **X-axis**:
- Label: "Per-step Length (in number of tokens)"
- Scale: 0 to 200 (increments of 50)
- Units: Tokens (discrete intervals)
- **Bars**:
- Color: Blue (uniform across all bars)
- Orientation: Vertical
- **Legend**: Absent
### Detailed Analysis
1. **Per-step Length Intervals**:
- Bins are grouped in ranges (e.g., 0–10, 10–20, etc.), though exact bin widths are not labeled.
- The first bin (0–10 tokens) contains the highest count, approximately **2.0×10⁵**.
- Counts decrease monotonically with increasing per-step length:
- 10–20 tokens: ~1.8×10⁵
- 20–30 tokens: ~1.5×10⁵
- 30–40 tokens: ~1.2×10⁵
- 40–50 tokens: ~1.0×10⁵
- 50–60 tokens: ~0.8×10⁵
- Subsequent bins show gradual declines, with counts dropping below 0.1×10⁵ by 100 tokens.
- The last non-zero bar appears near 100 tokens, with counts near 0.01×10⁵.
2. **Data Trends**:
- The distribution follows a **long-tailed pattern**, with the majority of data concentrated in the first 50 tokens.
- After 50 tokens, counts drop sharply, forming a steep decline.
- No secondary peaks or anomalies are observed.
### Key Observations
- **Dominance of Short Per-step Lengths**: Over 90% of counts occur within the first 50 tokens.
- **Long Tail**: A small fraction of instances extend to 100+ tokens, but these are rare.
- **No Outliers**: No isolated bars or irregularities in the distribution.
### Interpretation
The histogram suggests that **OmegaPRM** predominantly operates with short per-step lengths, likely reflecting a design optimized for efficiency or specific task constraints. The long tail indicates occasional longer steps, which could represent complex reasoning or edge cases. The absence of a legend implies a single data series, and the uniform bar color reinforces this simplicity. The skewed distribution highlights the importance of short-step processing in the system’s behavior, with longer steps being statistically insignificant but potentially critical for understanding rare events.