## Line Chart: Model Accuracy vs Number of Operands
### Overview
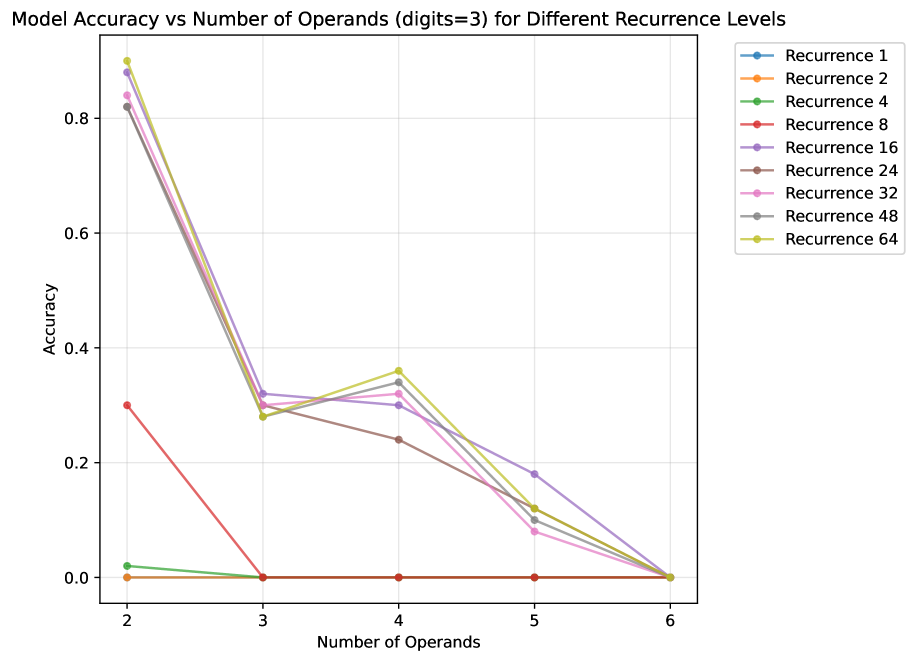
This line chart depicts the relationship between model accuracy and the number of operands, for models with varying levels of recurrence. The chart focuses on models trained with digits=3. The x-axis represents the number of operands, ranging from 2 to 6. The y-axis represents the accuracy, ranging from 0 to 0.9. Multiple lines represent different recurrence levels.
### Components/Axes
* **Title:** "Model Accuracy vs Number of Operands (digits=3) for Different Recurrence Levels" - positioned at the top-center of the chart.
* **X-axis Label:** "Number of Operands" - positioned at the bottom-center of the chart.
* X-axis Markers: 2, 3, 4, 5, 6
* **Y-axis Label:** "Accuracy" - positioned at the left-center of the chart.
* Y-axis Markers: 0, 0.2, 0.4, 0.6, 0.8, 1.0
* **Legend:** Located at the top-right of the chart.
* Recurrence 1 (Blue)
* Recurrence 2 (Orange)
* Recurrence 4 (Green)
* Recurrence 8 (Red)
* Recurrence 16 (Purple)
* Recurrence 24 (Pink)
* Recurrence 32 (Gray)
* Recurrence 48 (Cyan)
* Recurrence 64 (Yellow)
### Detailed Analysis
Here's a breakdown of each line's trend and approximate data points, cross-referencing with the legend colors:
* **Recurrence 1 (Blue):** The line slopes downward, starting at approximately 0.25 at 2 operands, decreasing to approximately 0.15 at 6 operands.
* **Recurrence 2 (Orange):** This line shows a steep decline, starting at approximately 0.85 at 2 operands, dropping to approximately 0.05 at 3 operands, and remaining near 0 for the rest of the operand range.
* **Recurrence 4 (Green):** The line starts at approximately 0.9 at 2 operands, decreases to approximately 0.3 at 3 operands, and then fluctuates between approximately 0.25 and 0.35 for the remaining operand values.
* **Recurrence 8 (Red):** This line begins at approximately 0.3 at 2 operands, drops to approximately 0.0 at 3 operands, and remains near 0 for the rest of the operand range.
* **Recurrence 16 (Purple):** The line starts at approximately 0.3 at 2 operands, decreases to approximately 0.25 at 3 operands, and then fluctuates between approximately 0.25 and 0.35 for the remaining operand values.
* **Recurrence 24 (Pink):** The line starts at approximately 0.25 at 2 operands, decreases to approximately 0.15 at 3 operands, and then fluctuates between approximately 0.15 and 0.25 for the remaining operand values.
* **Recurrence 32 (Gray):** The line starts at approximately 0.25 at 2 operands, decreases to approximately 0.15 at 3 operands, and then fluctuates between approximately 0.15 and 0.25 for the remaining operand values.
* **Recurrence 48 (Cyan):** The line starts at approximately 0.2 at 2 operands, decreases to approximately 0.1 at 3 operands, and then fluctuates between approximately 0.1 and 0.2 for the remaining operand values.
* **Recurrence 64 (Yellow):** The line starts at approximately 0.15 at 2 operands, decreases to approximately 0.05 at 3 operands, and then fluctuates between approximately 0.05 and 0.1 for the remaining operand values.
### Key Observations
* Recurrence 2 exhibits a dramatic drop in accuracy as the number of operands increases beyond 2.
* Recurrence 4 shows the highest initial accuracy at 2 operands.
* For most recurrence levels (4, 16, 24, 32, 48, 64), the accuracy plateaus or fluctuates slightly between 3 and 6 operands.
* Recurrence 8 also shows a rapid decline in accuracy after 2 operands.
* The lines for Recurrence 16, 24, 32, 48, and 64 are clustered together, indicating similar performance.
### Interpretation
The chart suggests that increasing the number of operands generally decreases model accuracy, particularly for lower recurrence levels (2 and 8). The steep decline in accuracy for Recurrence 2 indicates that this model struggles to generalize as the complexity of the input (number of operands) increases. The plateauing of accuracy for higher recurrence levels (16, 24, 32, 48, 64) suggests that these models may have reached a point of diminishing returns, where adding more operands does not significantly improve performance. The initial high accuracy of Recurrence 4 could indicate a sweet spot for this specific configuration with digits=3. The data implies that there is a trade-off between model complexity (recurrence level) and the ability to handle increasing input complexity (number of operands). The fact that the lines converge at higher operand counts suggests that all models eventually perform similarly poorly as the problem becomes more difficult.