\n
## Heatmaps: FCNN Parameter Space Loss Visualization
### Overview
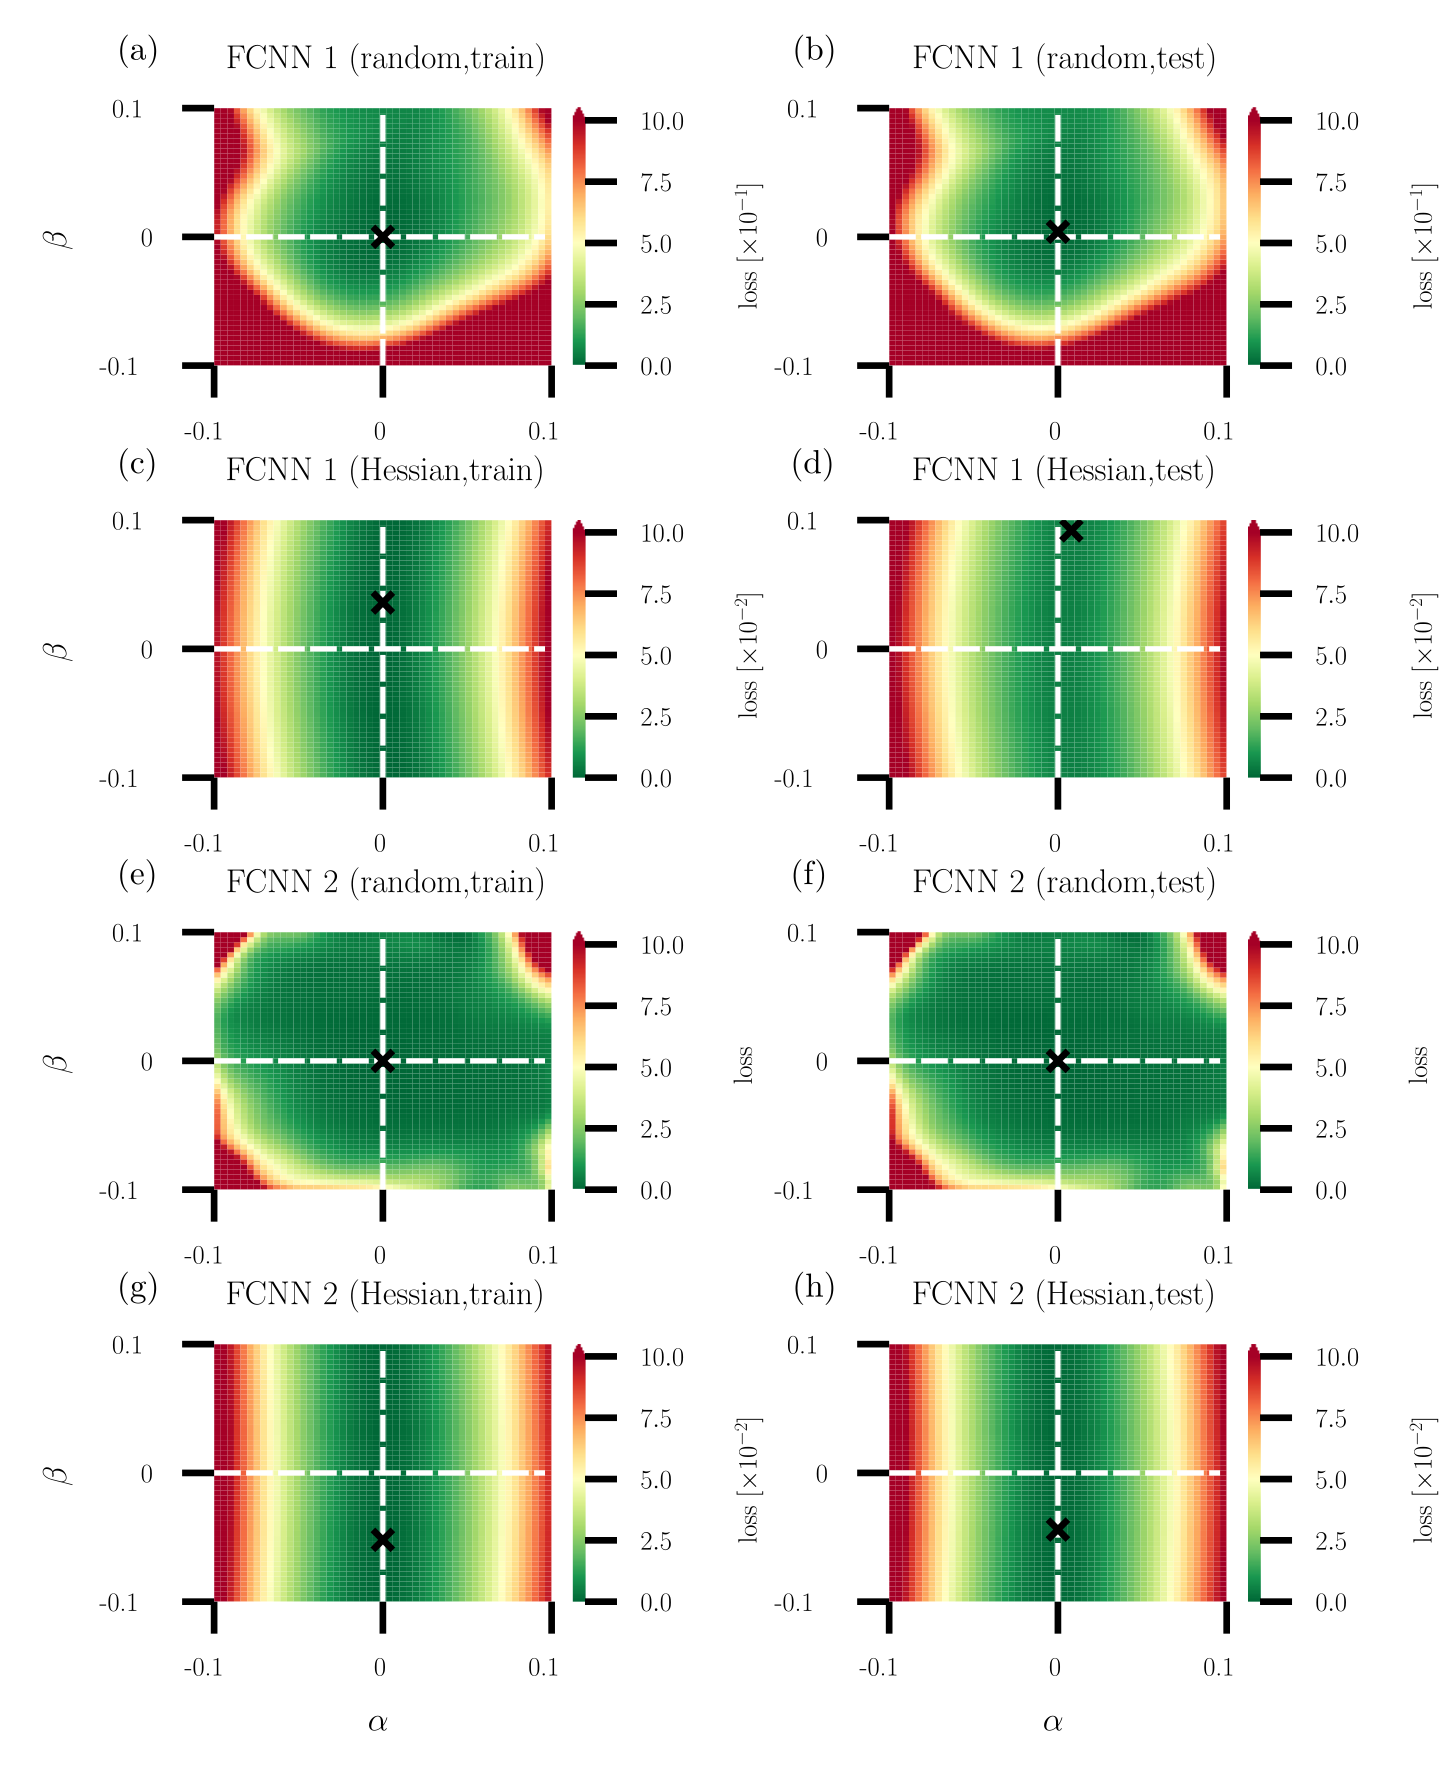
The image presents eight heatmaps, each visualizing the loss function of a Fully Connected Neural Network (FCNN) across a parameter space defined by α and β. Each heatmap corresponds to a specific training/testing scenario and network configuration (FCNN 1 or FCNN 2, trained with either random or Hessian initialization). A black 'x' marks the point of minimum loss on each heatmap. The color scale represents the loss value, ranging from 0.0 to 10.0.
### Components/Axes
Each heatmap shares the following components:
* **X-axis:** Labeled "α" with a scale ranging from -0.1 to 0.1.
* **Y-axis:** Labeled "β" with a scale ranging from -0.1 to 0.1.
* **Colorbar:** Located to the right of each heatmap, representing the "Loss [x10⁻²]" scale from 0.0 (dark green) to 10.0 (dark red).
* **Title:** Each heatmap has a title indicating the network (FCNN 1 or FCNN 2) and the training method (random or Hessian) along with whether it represents the training or testing set.
* **Minimum Loss Marker:** A black 'x' indicates the approximate location of the minimum loss within the parameter space.
### Detailed Analysis or Content Details
Here's a breakdown of each heatmap, including approximate coordinates of the minimum loss marker ('x'):
**(a) FCNN 1 (random, train):**
* Trend: The loss appears to decrease towards the center of the parameter space.
* Minimum Loss Location: Approximately (0.0, 0.0).
* Loss Value at Minimum: Approximately 0.5 (estimated from the colorbar).
**(b) FCNN 1 (random, test):**
* Trend: Similar to (a), loss decreases towards the center.
* Minimum Loss Location: Approximately (0.0, 0.0).
* Loss Value at Minimum: Approximately 1.0 (estimated from the colorbar).
**(c) FCNN 1 (Hessian, train):**
* Trend: Loss is concentrated around the center, with a clear minimum.
* Minimum Loss Location: Approximately (0.0, 0.0).
* Loss Value at Minimum: Approximately 0.1 (estimated from the colorbar).
**(d) FCNN 1 (Hessian, test):**
* Trend: Similar to (c), loss is concentrated around the center.
* Minimum Loss Location: Approximately (0.0, 0.0).
* Loss Value at Minimum: Approximately 0.5 (estimated from the colorbar).
**(e) FCNN 2 (random, train):**
* Trend: Loss is more spread out, with a broad minimum.
* Minimum Loss Location: Approximately (0.0, 0.0).
* Loss Value at Minimum: Approximately 1.5 (estimated from the colorbar).
**(f) FCNN 2 (random, test):**
* Trend: Similar to (e), loss is spread out.
* Minimum Loss Location: Approximately (0.0, 0.0).
* Loss Value at Minimum: Approximately 2.0 (estimated from the colorbar).
**(g) FCNN 2 (Hessian, train):**
* Trend: Loss is concentrated around the center, with a clear minimum.
* Minimum Loss Location: Approximately (0.0, 0.0).
* Loss Value at Minimum: Approximately 0.2 (estimated from the colorbar).
**(h) FCNN 2 (Hessian, test):**
* Trend: Similar to (g), loss is concentrated around the center.
* Minimum Loss Location: Approximately (0.0, 0.0).
* Loss Value at Minimum: Approximately 0.7 (estimated from the colorbar).
### Key Observations
* **Hessian Initialization:** Using the Hessian initialization consistently results in lower loss values, both during training and testing, compared to random initialization for both FCNNs.
* **FCNN 1 vs. FCNN 2:** FCNN 1 generally achieves lower loss values than FCNN 2, particularly when using Hessian initialization.
* **Training vs. Testing:** Loss values are generally higher on the test set than on the training set for both networks and both initialization methods, indicating some degree of overfitting.
* **Minimum Location:** The minimum loss consistently occurs around α = 0.0 and β = 0.0 for all scenarios.
### Interpretation
The heatmaps demonstrate the impact of initialization methods (random vs. Hessian) on the training and generalization performance of two different FCNN architectures. The Hessian initialization appears to be a more effective strategy for finding parameter values that minimize loss, leading to better performance on both training and testing data. The consistent location of the minimum loss at α = 0.0 and β = 0.0 suggests that these parameter values represent a stable and optimal configuration for both networks. The difference in loss values between FCNN 1 and FCNN 2 indicates that the network architecture itself plays a significant role in determining the model's ability to learn and generalize. The higher loss on the test set compared to the training set suggests that both networks are prone to overfitting, and regularization techniques might be necessary to improve their generalization performance. The visualization provides a clear and intuitive way to understand the relationship between network parameters and loss, aiding in the optimization and design of FCNNs.