## Dot Plot: Number of Trials for Concept Learning
### Overview
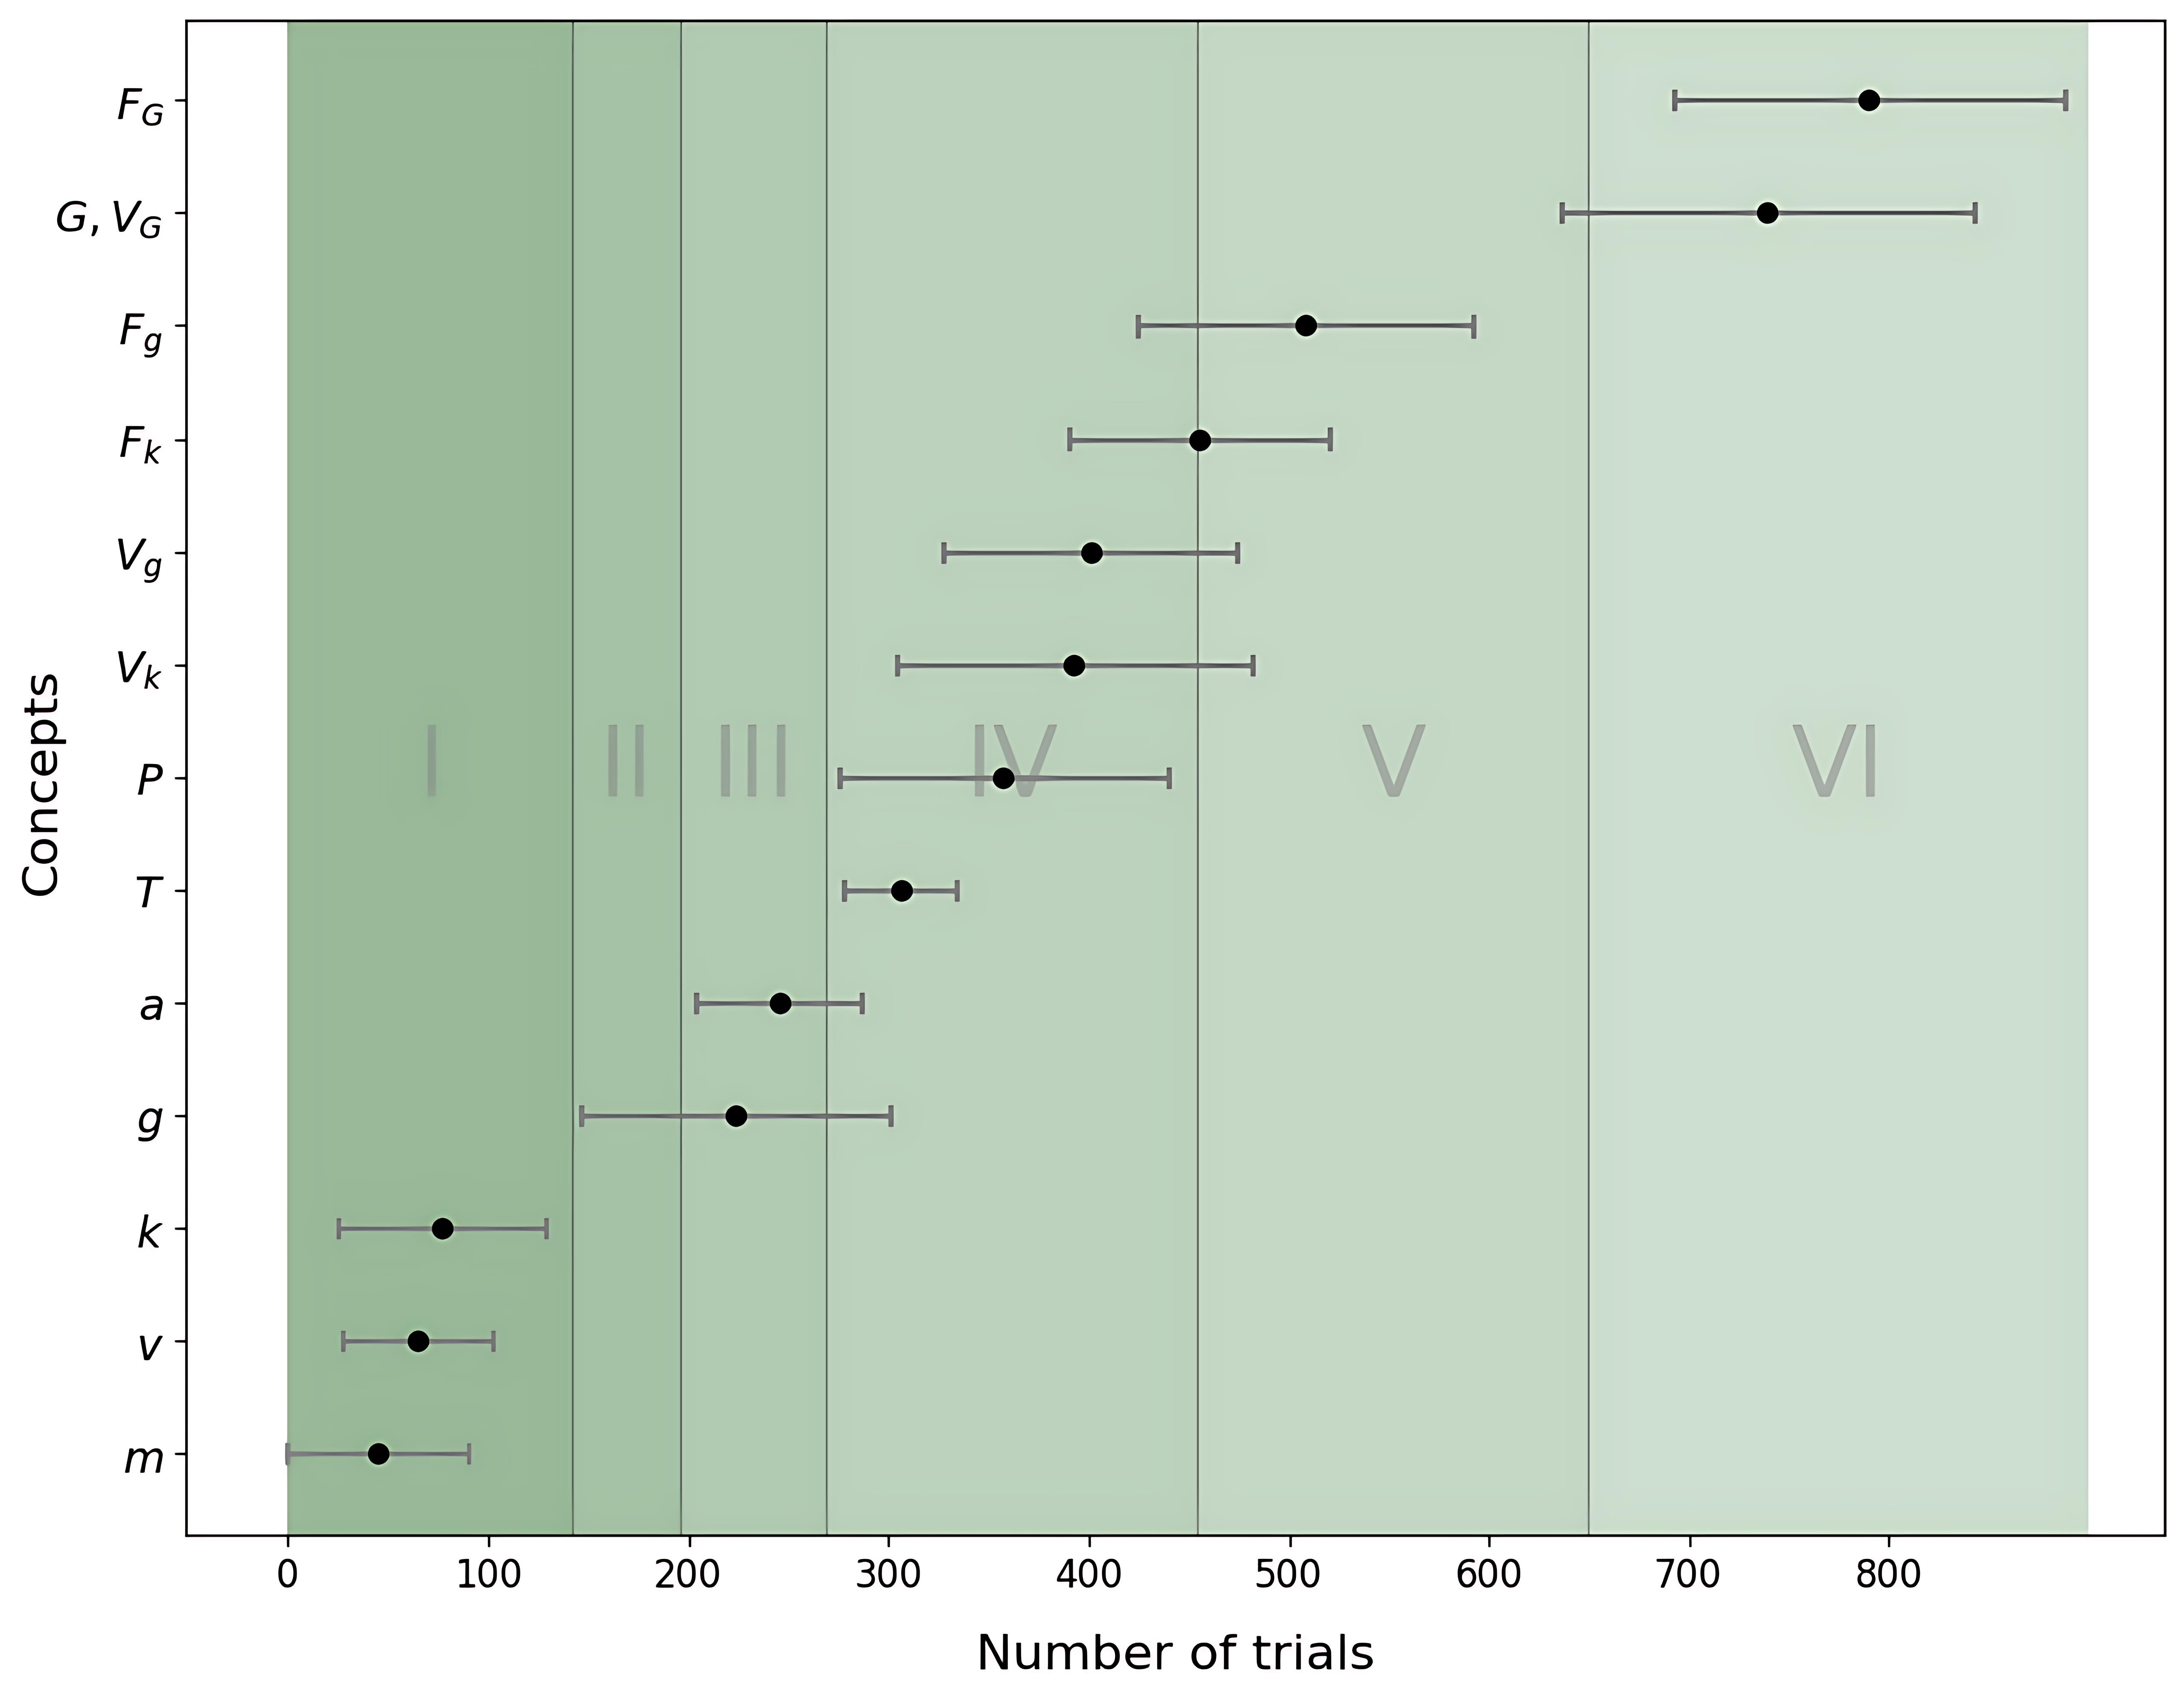
The image is a dot plot showing the number of trials required to learn different concepts. The x-axis represents the number of trials, and the y-axis lists the concepts. Each concept has a dot representing the mean number of trials, with error bars indicating the variability. The plot is divided into six regions, labeled I through VI, with varying shades of green.
### Components/Axes
* **X-axis:** "Number of trials", ranging from 0 to 800, with tick marks at intervals of 100.
* **Y-axis:** "Concepts", listing the following concepts from bottom to top: m, V, k, g, a, T, P, Vk, Vg, Fk, Fg, G, VG, FG.
* **Data Points:** Black dots represent the mean number of trials for each concept.
* **Error Bars:** Gray horizontal lines extending from each dot, indicating the range of trials.
* **Background Regions:** Six vertical regions labeled I, II, III, IV, V, and VI, shaded with different intensities of green. The Roman numerals are in light gray.
### Detailed Analysis
Here's a breakdown of the data for each concept, including the approximate mean number of trials and the range indicated by the error bars:
* **m:** Mean ~60 trials, Range ~20-100 trials.
* **V:** Mean ~70 trials, Range ~30-110 trials.
* **k:** Mean ~80 trials, Range ~30-130 trials.
* **g:** Mean ~220 trials, Range ~150-290 trials.
* **a:** Mean ~240 trials, Range ~200-280 trials.
* **T:** Mean ~310 trials, Range ~280-340 trials.
* **P:** Mean ~350 trials, Range ~300-400 trials.
* **Vk:** Mean ~400 trials, Range ~350-450 trials.
* **Vg:** Mean ~420 trials, Range ~380-460 trials.
* **Fk:** Mean ~450 trials, Range ~400-500 trials.
* **Fg:** Mean ~500 trials, Range ~450-550 trials.
* **G, VG:** Mean ~750 trials, Range ~700-800 trials.
* **FG:** Mean ~780 trials, Range ~730-830 trials.
The background regions are defined as follows:
* **Region I:** 0-150 trials
* **Region II:** 150-225 trials
* **Region III:** 225-300 trials
* **Region IV:** 300-400 trials
* **Region V:** 400-650 trials
* **Region VI:** 650-850 trials
### Key Observations
* The number of trials required to learn the concepts varies significantly.
* Concepts 'm', 'V', and 'k' require the fewest trials, while 'G, VG' and 'FG' require the most.
* The error bars indicate variability in the number of trials needed for each concept.
* The concepts are generally ordered from easiest to learn (fewest trials) to hardest to learn (most trials).
### Interpretation
The dot plot visualizes the difficulty of learning different concepts, as measured by the number of trials required. The data suggests a clear hierarchy in concept difficulty, with some concepts being learned much faster than others. The error bars provide insight into the consistency of learning for each concept. The background regions (I-VI) could represent different phases or levels of learning difficulty, with each concept falling into a specific region based on the number of trials needed for mastery. The plot could be used to compare the relative difficulty of different concepts and to identify concepts that are particularly easy or difficult to learn.