## Dot Plot: Distribution of Trials per Concept
### Overview
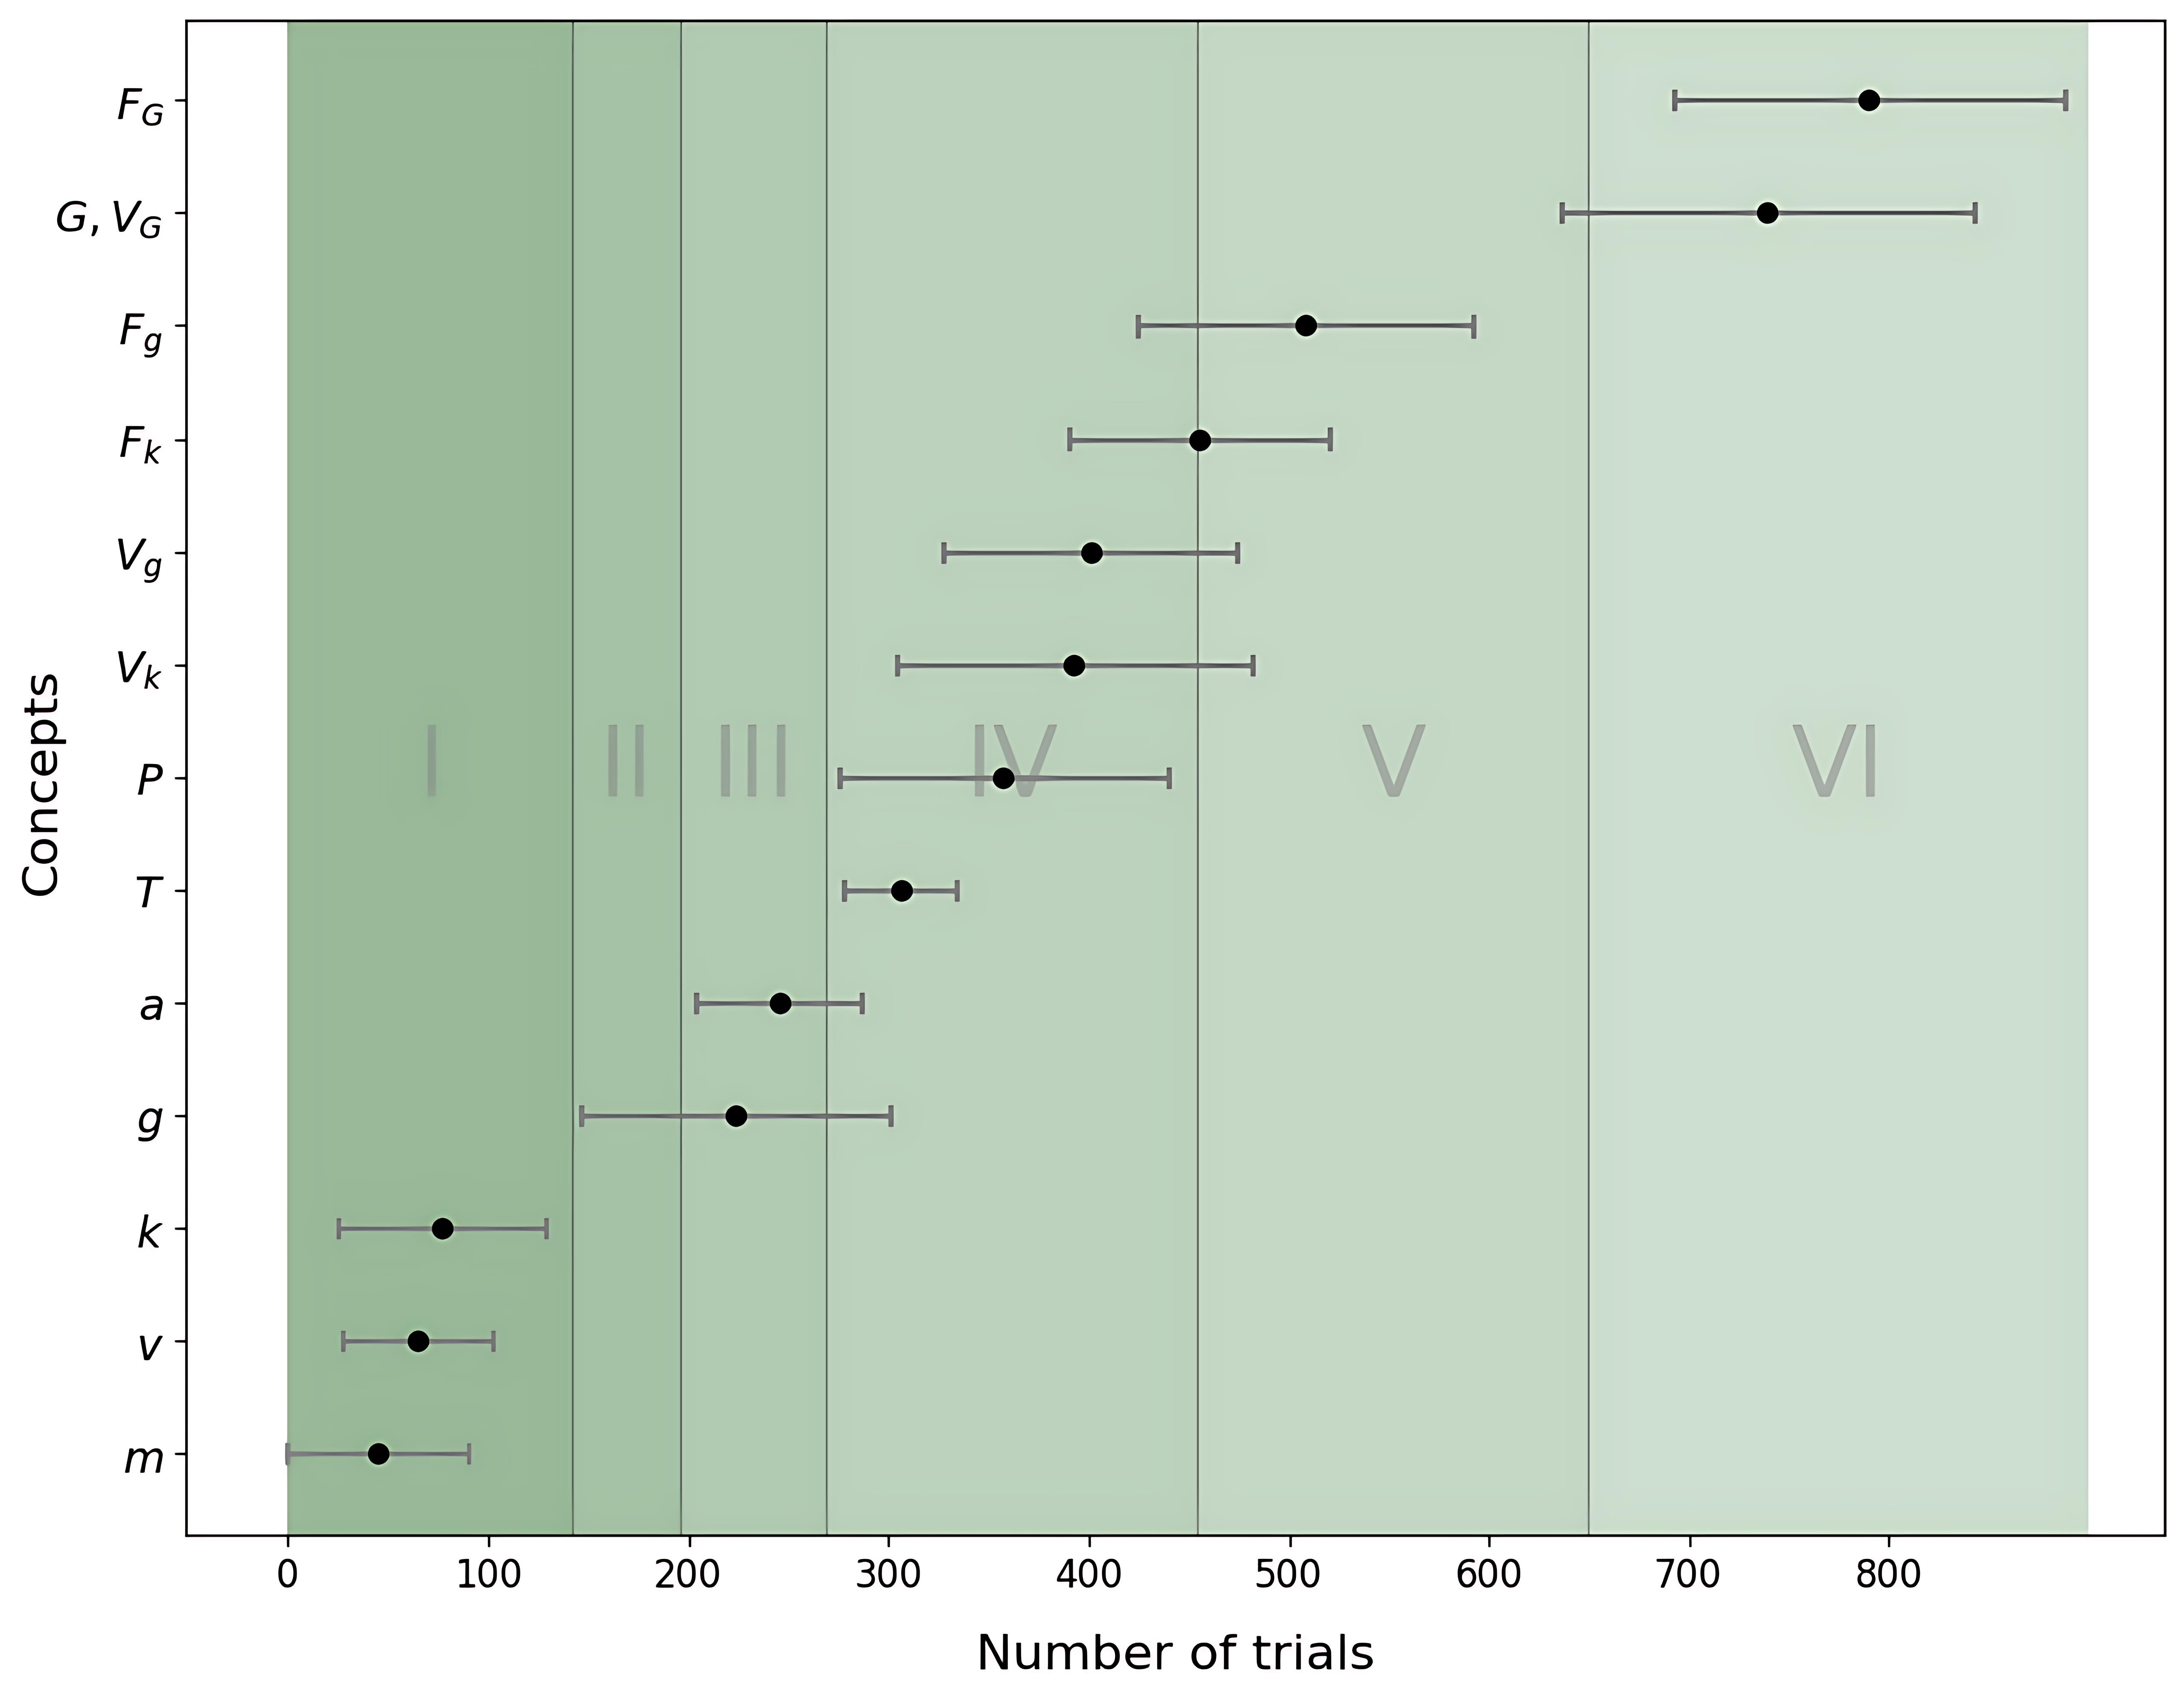
The image is a horizontal dot plot visualizing the "Number of trials" required for various "Concepts." The chart is divided into six vertical zones (labeled I through VI with faint Roman numerals) that segment the data based on the number of trials. Each concept is represented by a black dot indicating the mean or median value, with horizontal error bars representing the range or variance of the trials.
### Components/Axes
* **Y-Axis (Concepts):** Lists 14 distinct concepts, ordered from bottom to top: $m, v, k, g, a, T, P, V_k, V_g, F_k, F_g, G, V_G, F_G$.
* **X-Axis (Number of trials):** A linear scale ranging from 0 to 800+, with major tick marks every 100 units.
* **Zones:** The background is divided by vertical lines into six regions:
* **Zone I:** 0 to ~140
* **Zone II:** ~140 to ~200
* **Zone III:** ~200 to ~270
* **Zone IV:** ~270 to ~450
* **Zone V:** ~450 to ~650
* **Zone VI:** ~650 to 900+
### Detailed Analysis
The data points are distributed across the zones as follows (values are approximate):
| Concept | Zone | Approx. Mean/Center | Approx. Error Bar Range |
| :--- | :--- | :--- | :--- |
| **$m$** | I | 45 | 10 – 90 |
| **$v$** | I | 65 | 30 – 100 |
| **$k$** | I | 80 | 30 – 130 |
| **$g$** | III | 225 | 140 – 300 |
| **$a$** | III | 245 | 200 – 290 |
| **$T$** | IV | 310 | 280 – 340 |
| **$P$** | IV | 380 | 280 – 460 |
| **$V_k$** | IV | 390 | 310 – 480 |
| **$V_g$** | IV | 400 | 310 – 480 |
| **$F_k$** | V | 455 | 370 – 540 |
| **$F_g$** | V | 510 | 420 – 600 |
| **$G, V_G$** | VI | 740 | 640 – 840 |
| **$F_G$** | VI | 790 | 700 – 880 |
*Note: Zone II (140–200) contains no data points.*
### Key Observations
* **Progression:** There is a clear positive correlation between the listed concepts and the number of trials. As one moves up the Y-axis, the number of trials increases.
* **Clustering:** The concepts are grouped into distinct clusters. The most dense clustering occurs in Zone IV ($T, P, V_k, V_g$), where four concepts fall within a narrow range of ~310 to ~400 trials.
* **Variance:** The width of the error bars generally increases as the number of trials increases. Concepts with higher trial counts (e.g., $F_G$) exhibit significantly larger variance (error bars spanning ~180 units) compared to concepts with lower trial counts (e.g., $m$, spanning ~80 units).
* **Empty Zone:** Zone II is notably devoid of data, suggesting a "gap" in the complexity or trial requirements between the initial concepts ($m, v, k$) and the subsequent group ($g, a$).
### Interpretation
The data suggests a hierarchical structure in the complexity or difficulty of the concepts being measured. The "Number of trials" likely acts as a proxy for the computational or experimental effort required to resolve or verify each concept.
The progression from simple variables (like mass $m$ or velocity $v$) to more complex or derived variables (like forces $F_G$ or combined variables $G, V_G$) correlates strongly with an increased requirement for trials. The existence of distinct zones suggests that these concepts might be categorized into "difficulty tiers," where concepts within the same zone share similar experimental or computational requirements. The widening error bars at higher trial counts indicate that as the complexity of the concept increases, the uncertainty or variability in the number of trials required to reach a conclusion also increases significantly.