## Horizontal Dot Plot with Error Bars: Concept Acquisition Timeline
### Overview
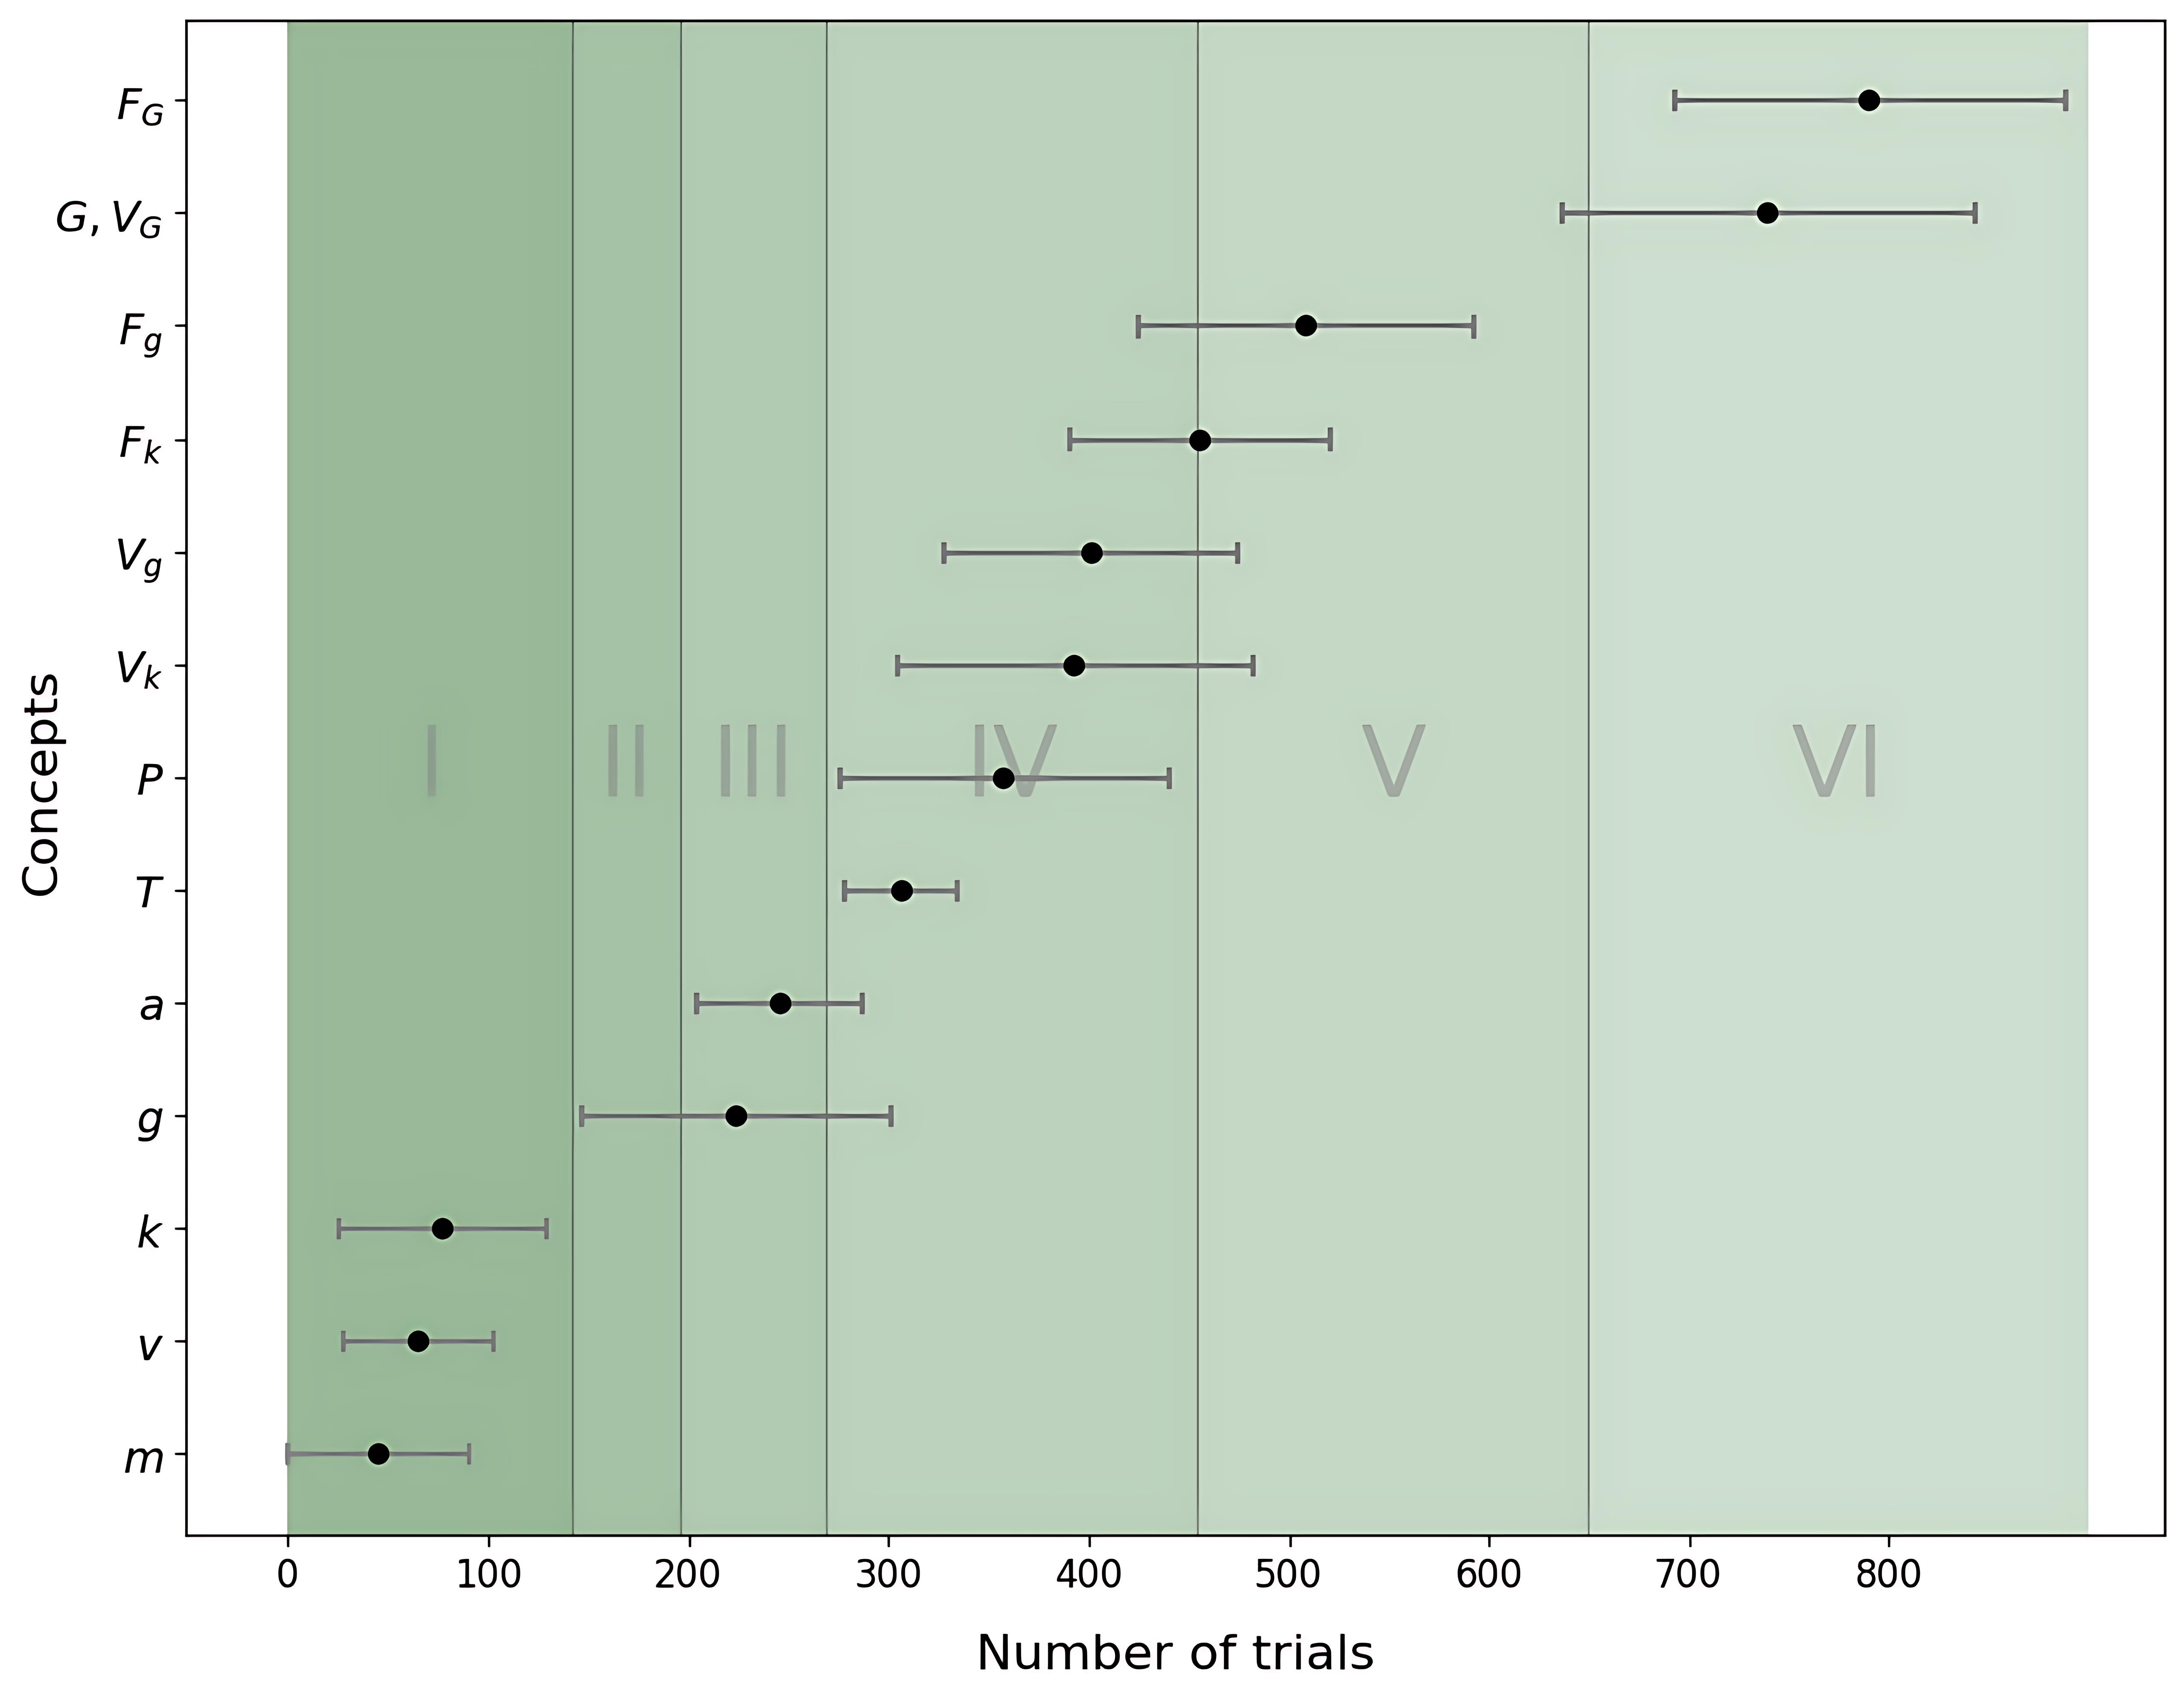
The image is a horizontal dot plot with error bars, illustrating the approximate number of trials required to acquire or master a series of related concepts. The concepts are listed vertically, and the number of trials is plotted on the horizontal axis. The background is segmented into six vertical, shaded regions labeled with Roman numerals (I-VI), representing distinct trial ranges or stages.
### Components/Axes
* **Vertical Axis (Y-axis):** Labeled **"Concepts"**. It lists 14 distinct concepts, ordered from bottom to top. The concepts are represented by symbols, likely variables from a scientific or mathematical domain:
* `m`, `v`, `k`, `g`, `a`, `T`, `P`, `V_k`, `V_g`, `F_k`, `F_g`, `G, V_G`, `F_G`.
* **Horizontal Axis (X-axis):** Labeled **"Number of trials"**. The scale runs from 0 to approximately 900, with major tick marks at 0, 100, 200, 300, 400, 500, 600, 700, and 800.
* **Data Series:** Each concept has a single data point represented by a black dot (likely the mean or median), with horizontal error bars (likely representing standard deviation, range, or confidence interval).
* **Background Regions (Stages):** The plot area is divided into six vertical bands of varying green shades, labeled with large, faint Roman numerals:
* **I:** Darkest green, spanning approximately 0 to 150 trials.
* **II:** Medium-dark green, spanning approximately 150 to 200 trials.
* **III:** Medium green, spanning approximately 200 to 275 trials.
* **IV:** Light-medium green, spanning approximately 275 to 450 trials.
* **V:** Light green, spanning approximately 450 to 650 trials.
* **VI:** Lightest green, spanning approximately 650 to 900 trials.
### Detailed Analysis
The following table reconstructs the approximate data points and their associated error ranges, read from the chart. Values are estimated based on visual alignment with the x-axis.
| Concept | Approx. Mean Trials | Approx. Error Bar Range (Min to Max) | Visual Trend & Stage |
| :--- | :--- | :--- | :--- |
| **m** | 50 | 0 to 100 | Lowest trial count. Within Stage I. |
| **v** | 70 | 30 to 110 | Slightly higher than `m`. Within Stage I. |
| **k** | 80 | 40 to 120 | Slightly higher than `v`. Within Stage I. |
| **g** | 220 | 150 to 300 | Significant jump. Spans Stages II and III. |
| **a** | 250 | 200 to 300 | Slightly higher than `g`. Within Stage III. |
| **T** | 300 | 280 to 320 | Narrow error bar, indicating consistency. At the boundary of Stages III and IV. |
| **P** | 350 | 280 to 420 | Wider error bar. Within Stage IV. |
| **V_k** | 400 | 300 to 480 | Within Stage IV. |
| **V_g** | 420 | 320 to 480 | Slightly higher than `V_k`. Within Stage IV. |
| **F_k** | 450 | 400 to 500 | At the boundary of Stages IV and V. |
| **F_g** | 500 | 420 to 580 | Within Stage V. |
| **G, V_G** | 750 | 650 to 850 | Large jump. Two concepts grouped together. Within Stage VI. |
| **F_G** | 800 | 700 to 900 | Highest trial count. Within Stage VI. |
**Trend Verification:** There is a clear, positive correlation between the vertical position of the concept (from `m` to `F_G`) and the number of trials required. The line formed by the data points slopes consistently upward from left to right.
### Key Observations
1. **Hierarchical Learning:** The concepts appear to be ordered in a hierarchy of increasing complexity or dependency. Foundational concepts (`m`, `v`, `k`) require the fewest trials (<100), while the most advanced concepts (`G, V_G`, `F_G`) require the most (>700).
2. **Stage Grouping:** The Roman numeral stages group concepts by trial ranges. Stage I contains the three simplest concepts. Stages IV and V contain the bulk of the intermediate concepts. Stage VI contains only the two most complex entries.
3. **Variable Precision:** The width of the error bars varies significantly. Concepts like `T` have very narrow bars, suggesting highly consistent acquisition times. Concepts like `g`, `P`, and `F_g` have wide bars, indicating high variability in the number of trials needed.
4. **Concept Grouping:** The label `G, V_G` indicates that these two concepts are either learned simultaneously or are so closely related that they are measured as a single unit in this analysis.
### Interpretation
This chart visualizes a **learning or skill acquisition timeline** for a set of interrelated concepts, likely from a domain like physics (given symbols for mass, velocity, gravity, force, etc.). The data suggests a structured, sequential learning path:
* **Foundation (Stage I):** Basic parameters (`m`, `v`, `k`) are acquired quickly and with relatively low variability.
* **Intermediate Development (Stages II-V):** More complex relationships and derived quantities (`g`, `a`, `T`, `P`, various `V` and `F` terms) require progressively more trials. The increasing width of some error bars here may reflect individual differences in learning these more abstract concepts.
* **Advanced Mastery (Stage VI):** The most complex, possibly integrative concepts (`G, V_G`, `F_G`) represent a significant leap in difficulty, requiring an order of magnitude more trials than the foundational concepts. The grouping of `G` and `V_G` hints at a strong conceptual link, perhaps representing a unified principle (like gravitational potential and its associated vector).
The overarching narrative is one of **cumulative complexity**. Mastery of later concepts is likely dependent on the solid acquisition of earlier ones, explaining the steep, non-linear increase in trials. The stages (I-VI) may correspond to formal levels of education, training modules, or natural breakpoints in the learning process. The chart effectively argues that advanced expertise in this domain is not just marginally harder, but requires a vastly greater investment of practice or exposure.