## Horizontal Bar Chart: Concept Trial Distribution
### Overview
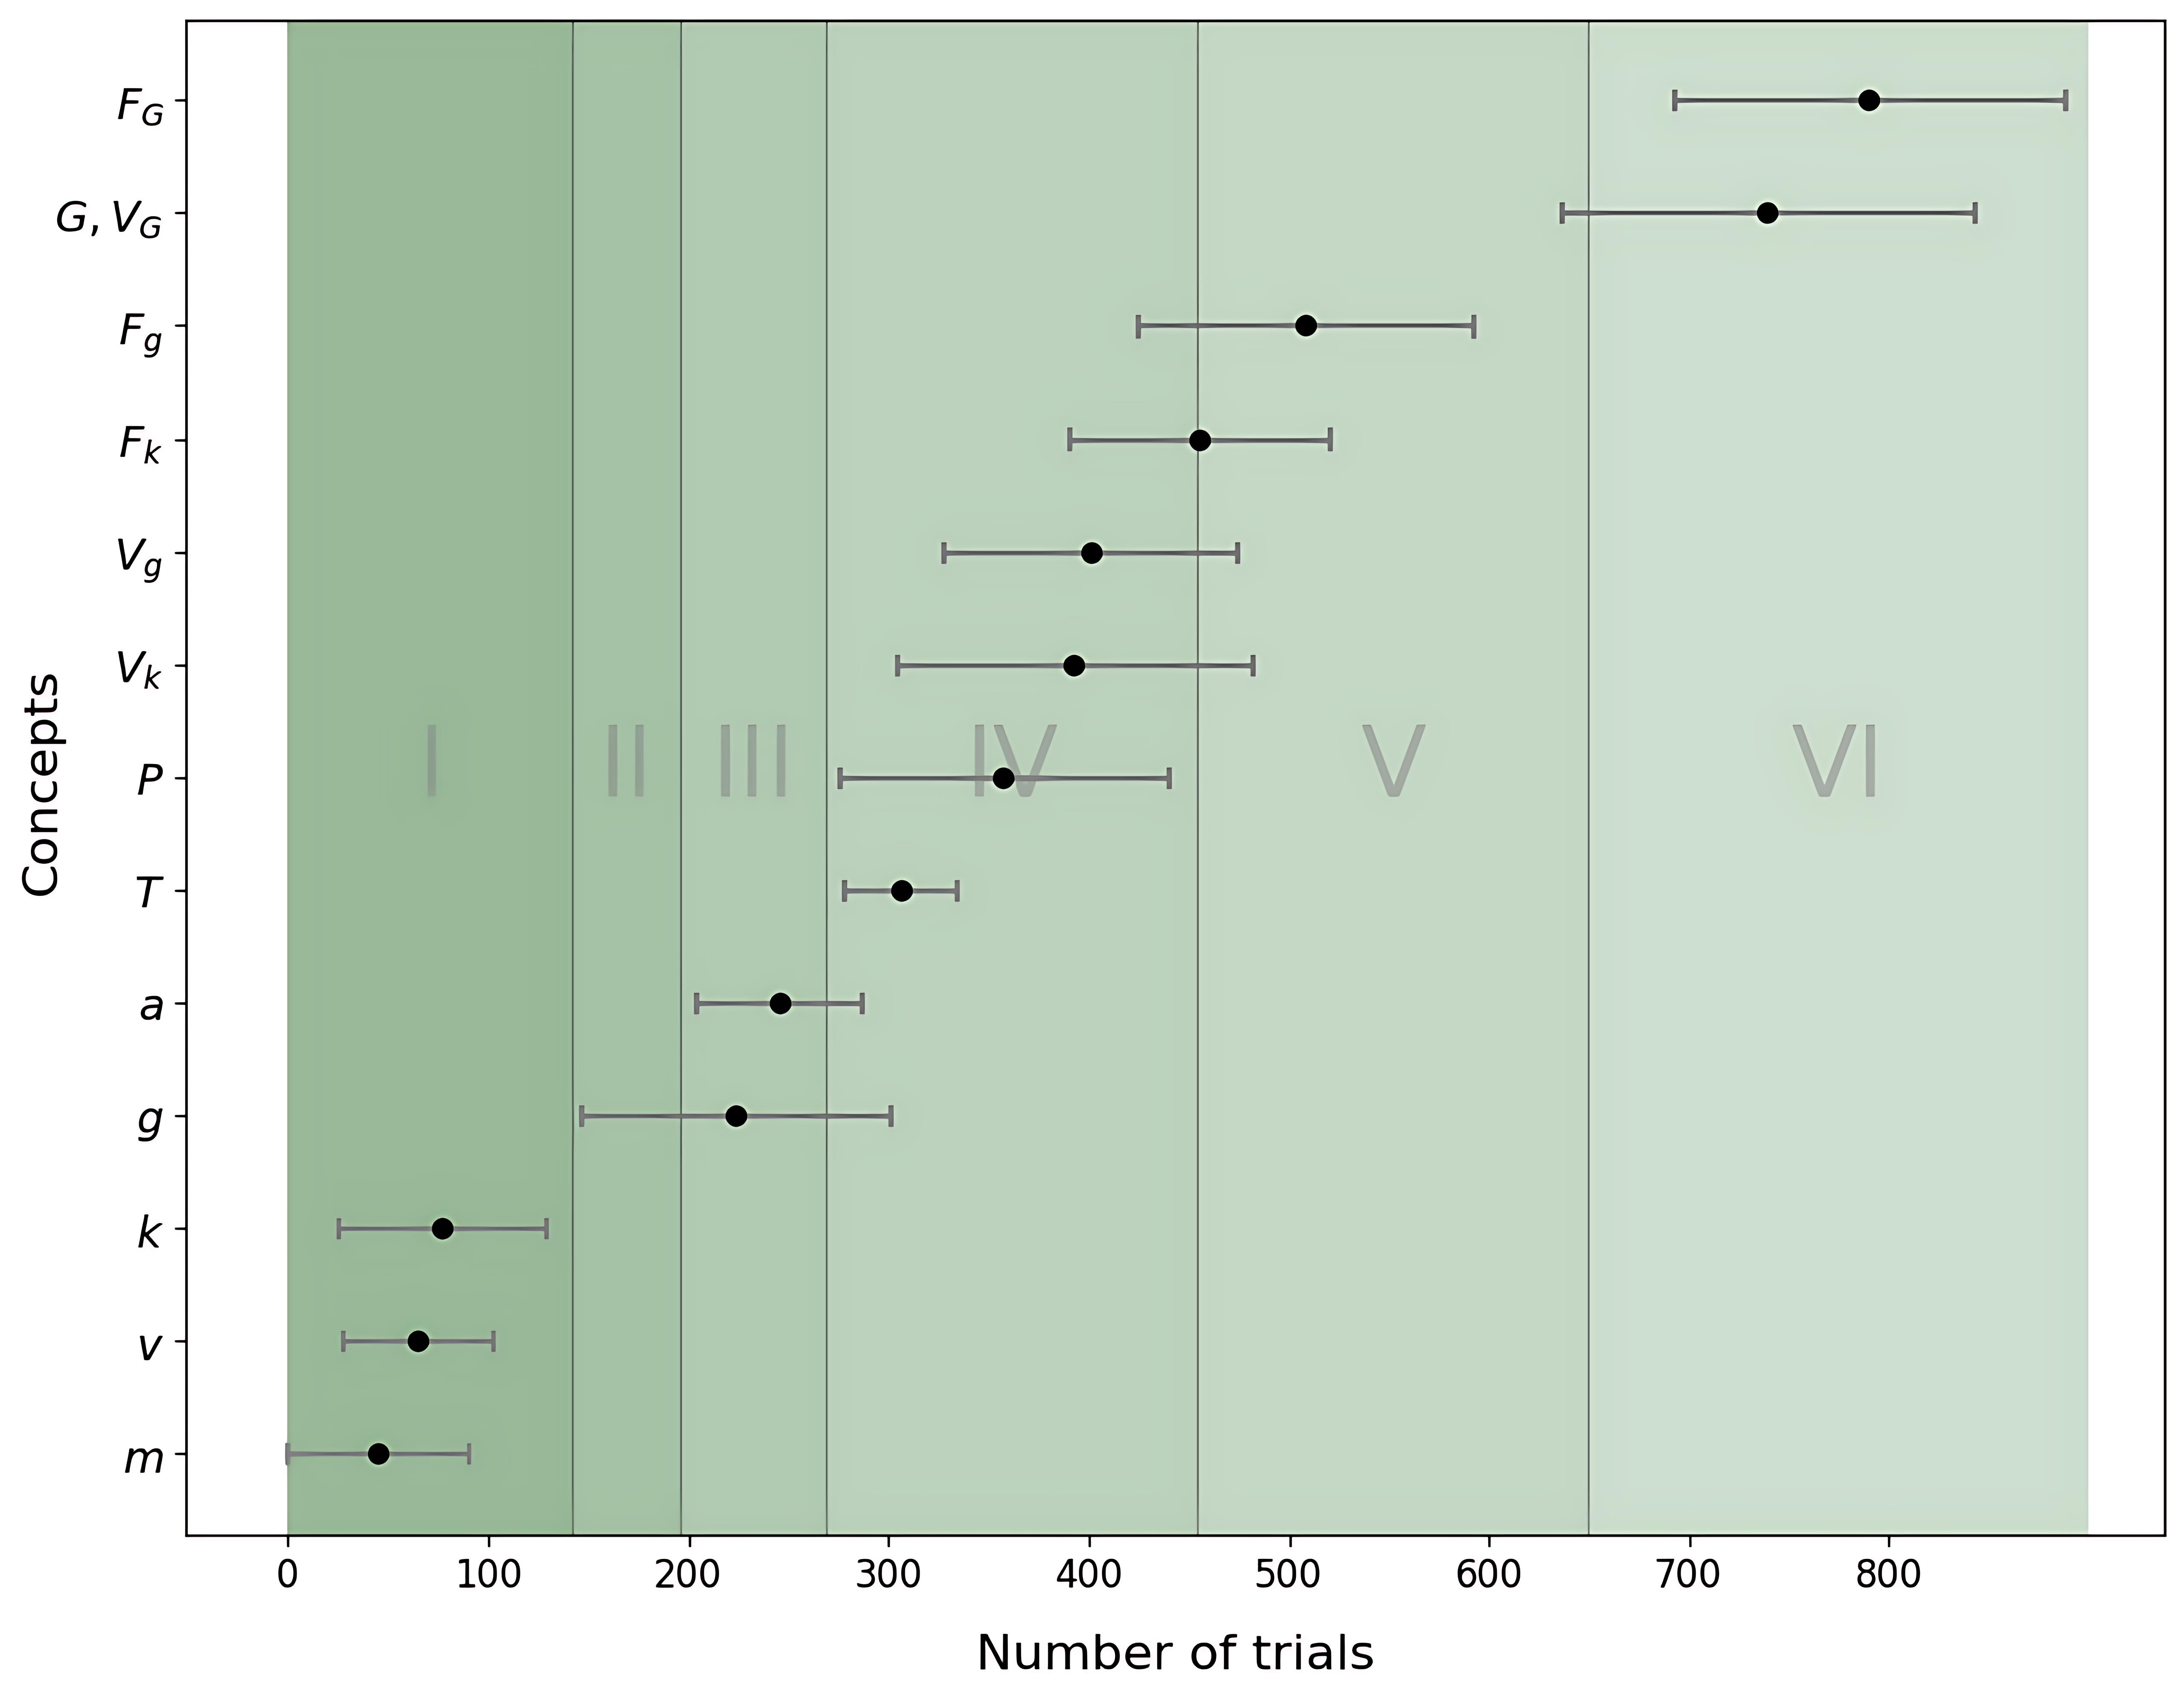
The image displays a horizontal bar chart comparing the number of trials associated with various concepts. The chart uses color-coded bars with error bars to represent variability. Roman numerals (I-VI) divide the x-axis into six sections, suggesting a categorical or phased structure.
### Components/Axes
- **Y-Axis (Concepts)**: Labels include `F_G`, `G`, `V_G`, `F_g`, `F_k`, `V_g`, `V_k`, `P`, `T`, `a`, `g`, `k`, `v`, `m`.
- **X-Axis (Number of Trials)**: Ranges from 0 to 800, divided into six sections labeled I–VI.
- **Legend**: Located on the right, associating colors with concepts (e.g., dark green for `F_G`, medium green for `G`, etc.).
- **Background**: Light green with darker green vertical lines separating sections I–VI.
### Detailed Analysis
1. **Concept Trial Values** (approximate, with error margins):
- `F_G`: 780 ± 40 (dark green, section VI)
- `G`: 740 ± 30 (medium green, section VI)
- `V_G`: 700 ± 25 (light green, section VI)
- `F_g`: 550 ± 35 (dark green, section V)
- `F_k`: 480 ± 20 (medium green, section IV)
- `V_g`: 450 ± 25 (light green, section IV)
- `V_k`: 420 ± 30 (dark green, section IV)
- `P`: 400 ± 50 (medium green, section IV)
- `T`: 300 ± 15 (light green, section III)
- `a`: 250 ± 10 (dark green, section III)
- `g`: 220 ± 15 (medium green, section II)
- `k`: 150 ± 10 (dark green, section II)
- `v`: 120 ± 5 (medium green, section I)
- `m`: 80 ± 10 (dark green, section I)
2. **Error Bars**:
- Largest variability: `P` (±50).
- Smallest variability: `v` (±5).
3. **Section Distribution**:
- **Section I**: `v` (120), `m` (80).
- **Section II**: `g` (220), `k` (150).
- **Section III**: `T` (300), `a` (250).
- **Section IV**: `F_k` (480), `V_g` (450), `V_k` (420), `P` (400).
- **Section V**: `F_g` (550).
- **Section VI**: `F_G` (780), `G` (740), `V_G` (700).
### Key Observations
- **Trend**: Concepts in later sections (V–VI) have significantly higher trial counts than earlier sections (I–III).
- **Outliers**: `P` (400 ± 50) has the largest error margin, suggesting high variability.
- **Color Consistency**: All bars match their legend colors (e.g., `F_G` is dark green, `G` is medium green).
### Interpretation
The data suggests a progressive increase in trial counts across sections I–VI, with concepts in later sections (e.g., `F_G`, `G`) dominating in trial volume. The error margins indicate that variability is highest for `P` and lowest for `v`. The Roman numerals likely represent phases or stages, implying a structured progression in trial allocation. The chart may reflect resource allocation, experimental design, or prioritization of concepts over time.