## Heatmap: MIND - Long-to-Short - Qwen-2.5 3B
### Overview
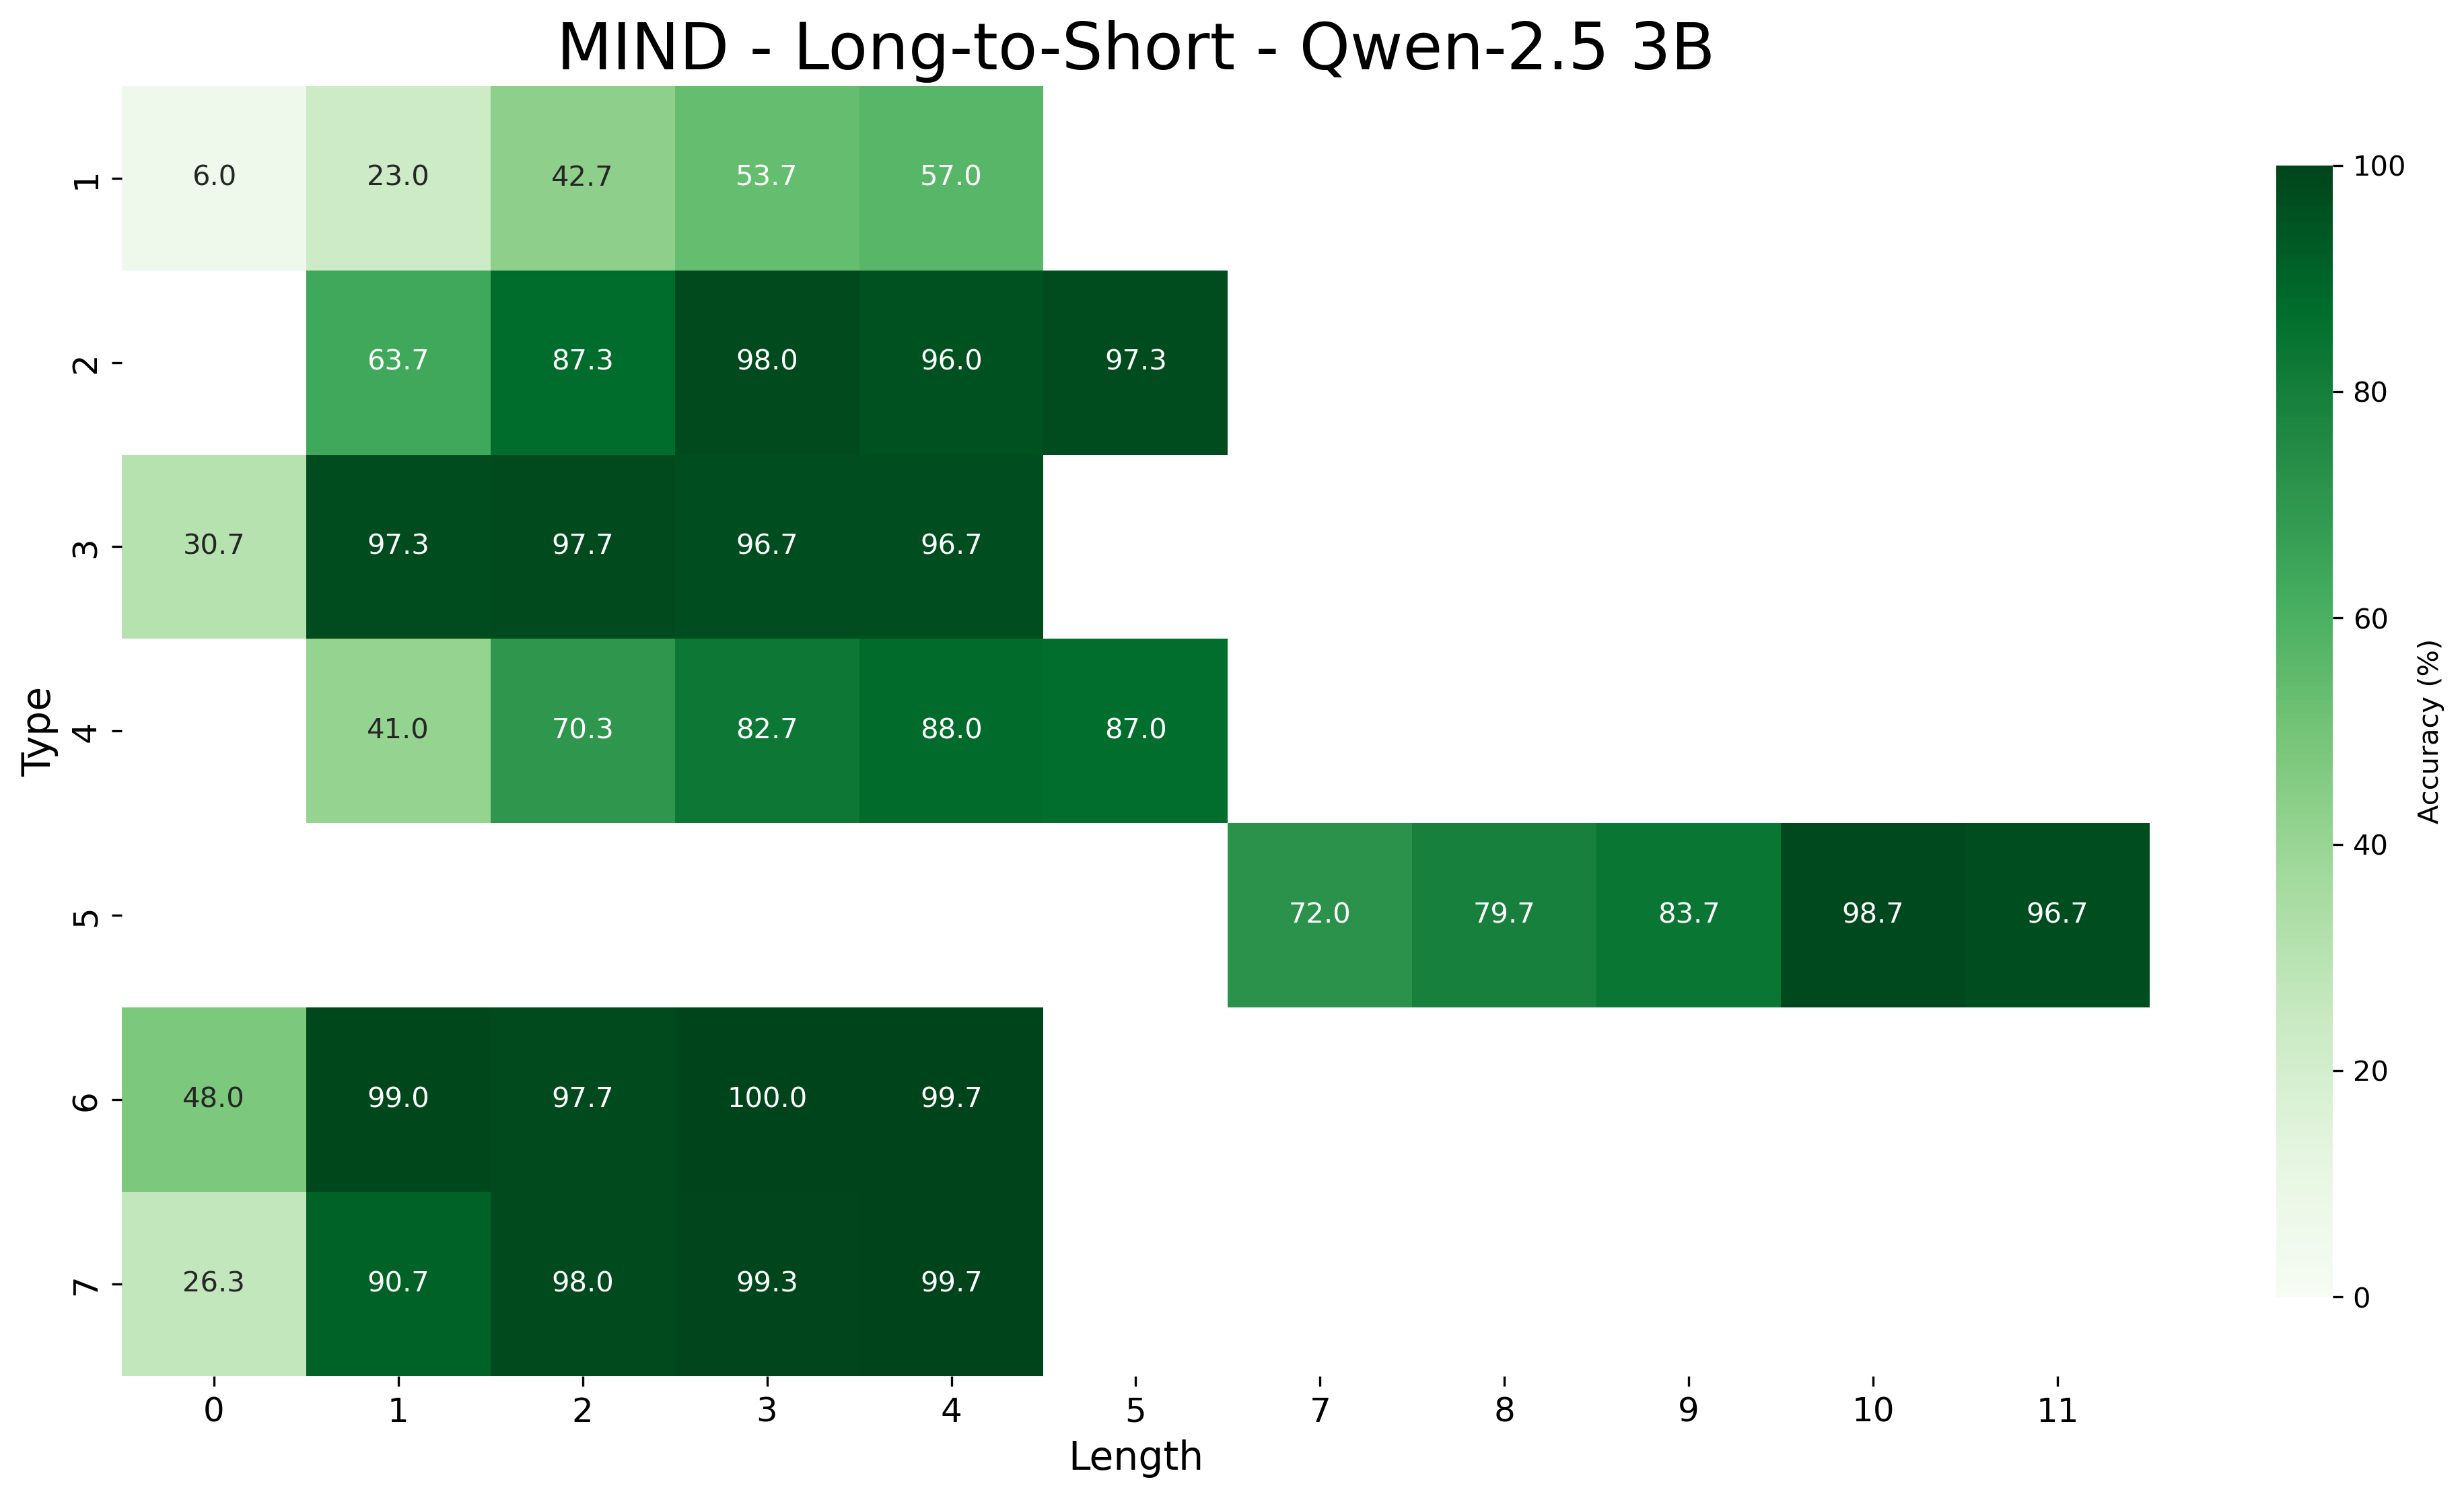
The image is a heatmap displaying the accuracy (%) of a model (Qwen-2.5 3B) on the MIND dataset for different types and lengths. The heatmap uses a green color gradient, where darker shades of green indicate higher accuracy and lighter shades indicate lower accuracy. The x-axis represents the length, and the y-axis represents the type.
### Components/Axes
* **Title:** MIND - Long-to-Short - Qwen-2.5 3B
* **X-axis:** Length, with values ranging from 0 to 11.
* **Y-axis:** Type, with values ranging from 1 to 7.
* **Colorbar (Right):** Accuracy (%), ranging from 0 to 100. Dark green corresponds to 100% accuracy, and light green corresponds to 0% accuracy.
### Detailed Analysis
The heatmap shows accuracy values for each combination of "Type" (1-7) and "Length" (0-11). Note that not all combinations are present in the data.
Here's a breakdown of the accuracy values for each type and length:
* **Type 1:**
* Length 0: 6.0%
* Length 1: 23.0%
* Length 2: 42.7%
* Length 3: 53.7%
* Length 4: 57.0%
* **Type 2:**
* Length 0: 63.7%
* Length 1: 87.3%
* Length 2: 98.0%
* Length 3: 96.0%
* Length 4: 97.3%
* **Type 3:**
* Length 0: 30.7%
* Length 1: 97.3%
* Length 2: 97.7%
* Length 3: 96.7%
* Length 4: 96.7%
* **Type 4:**
* Length 0: 41.0%
* Length 1: 70.3%
* Length 2: 82.7%
* Length 3: 88.0%
* Length 4: 87.0%
* **Type 5:**
* Length 7: 72.0%
* Length 8: 79.7%
* Length 9: 83.7%
* Length 10: 98.7%
* Length 11: 96.7%
* **Type 6:**
* Length 0: 48.0%
* Length 1: 99.0%
* Length 2: 97.7%
* Length 3: 100.0%
* Length 4: 99.7%
* **Type 7:**
* Length 0: 26.3%
* Length 1: 90.7%
* Length 2: 98.0%
* Length 3: 99.3%
* Length 4: 99.7%
### Key Observations
* Accuracy generally increases with length for most types, up to a certain length.
* Types 6 and 7 show high accuracy across lengths 1-4.
* Type 1 has the lowest accuracy across lengths 0-4.
* Type 5 only has data for lengths 7-11.
### Interpretation
The heatmap visualizes the performance of the Qwen-2.5 3B model on the MIND dataset, broken down by type and length. The data suggests that the model performs better on certain types and lengths than others. The lower accuracy for Type 1 across lengths 0-4 could indicate that this type is more challenging for the model. The high accuracy for Types 6 and 7 suggests that these types are easier for the model to process. The absence of data for certain type/length combinations might indicate that these combinations were not tested or are not applicable. The trend of increasing accuracy with length (up to a point) could be related to the model's ability to leverage more context as the input sequence becomes longer.