## Heatmap: MIND - Long-to-Short - Qwen-2.5 3B
### Overview
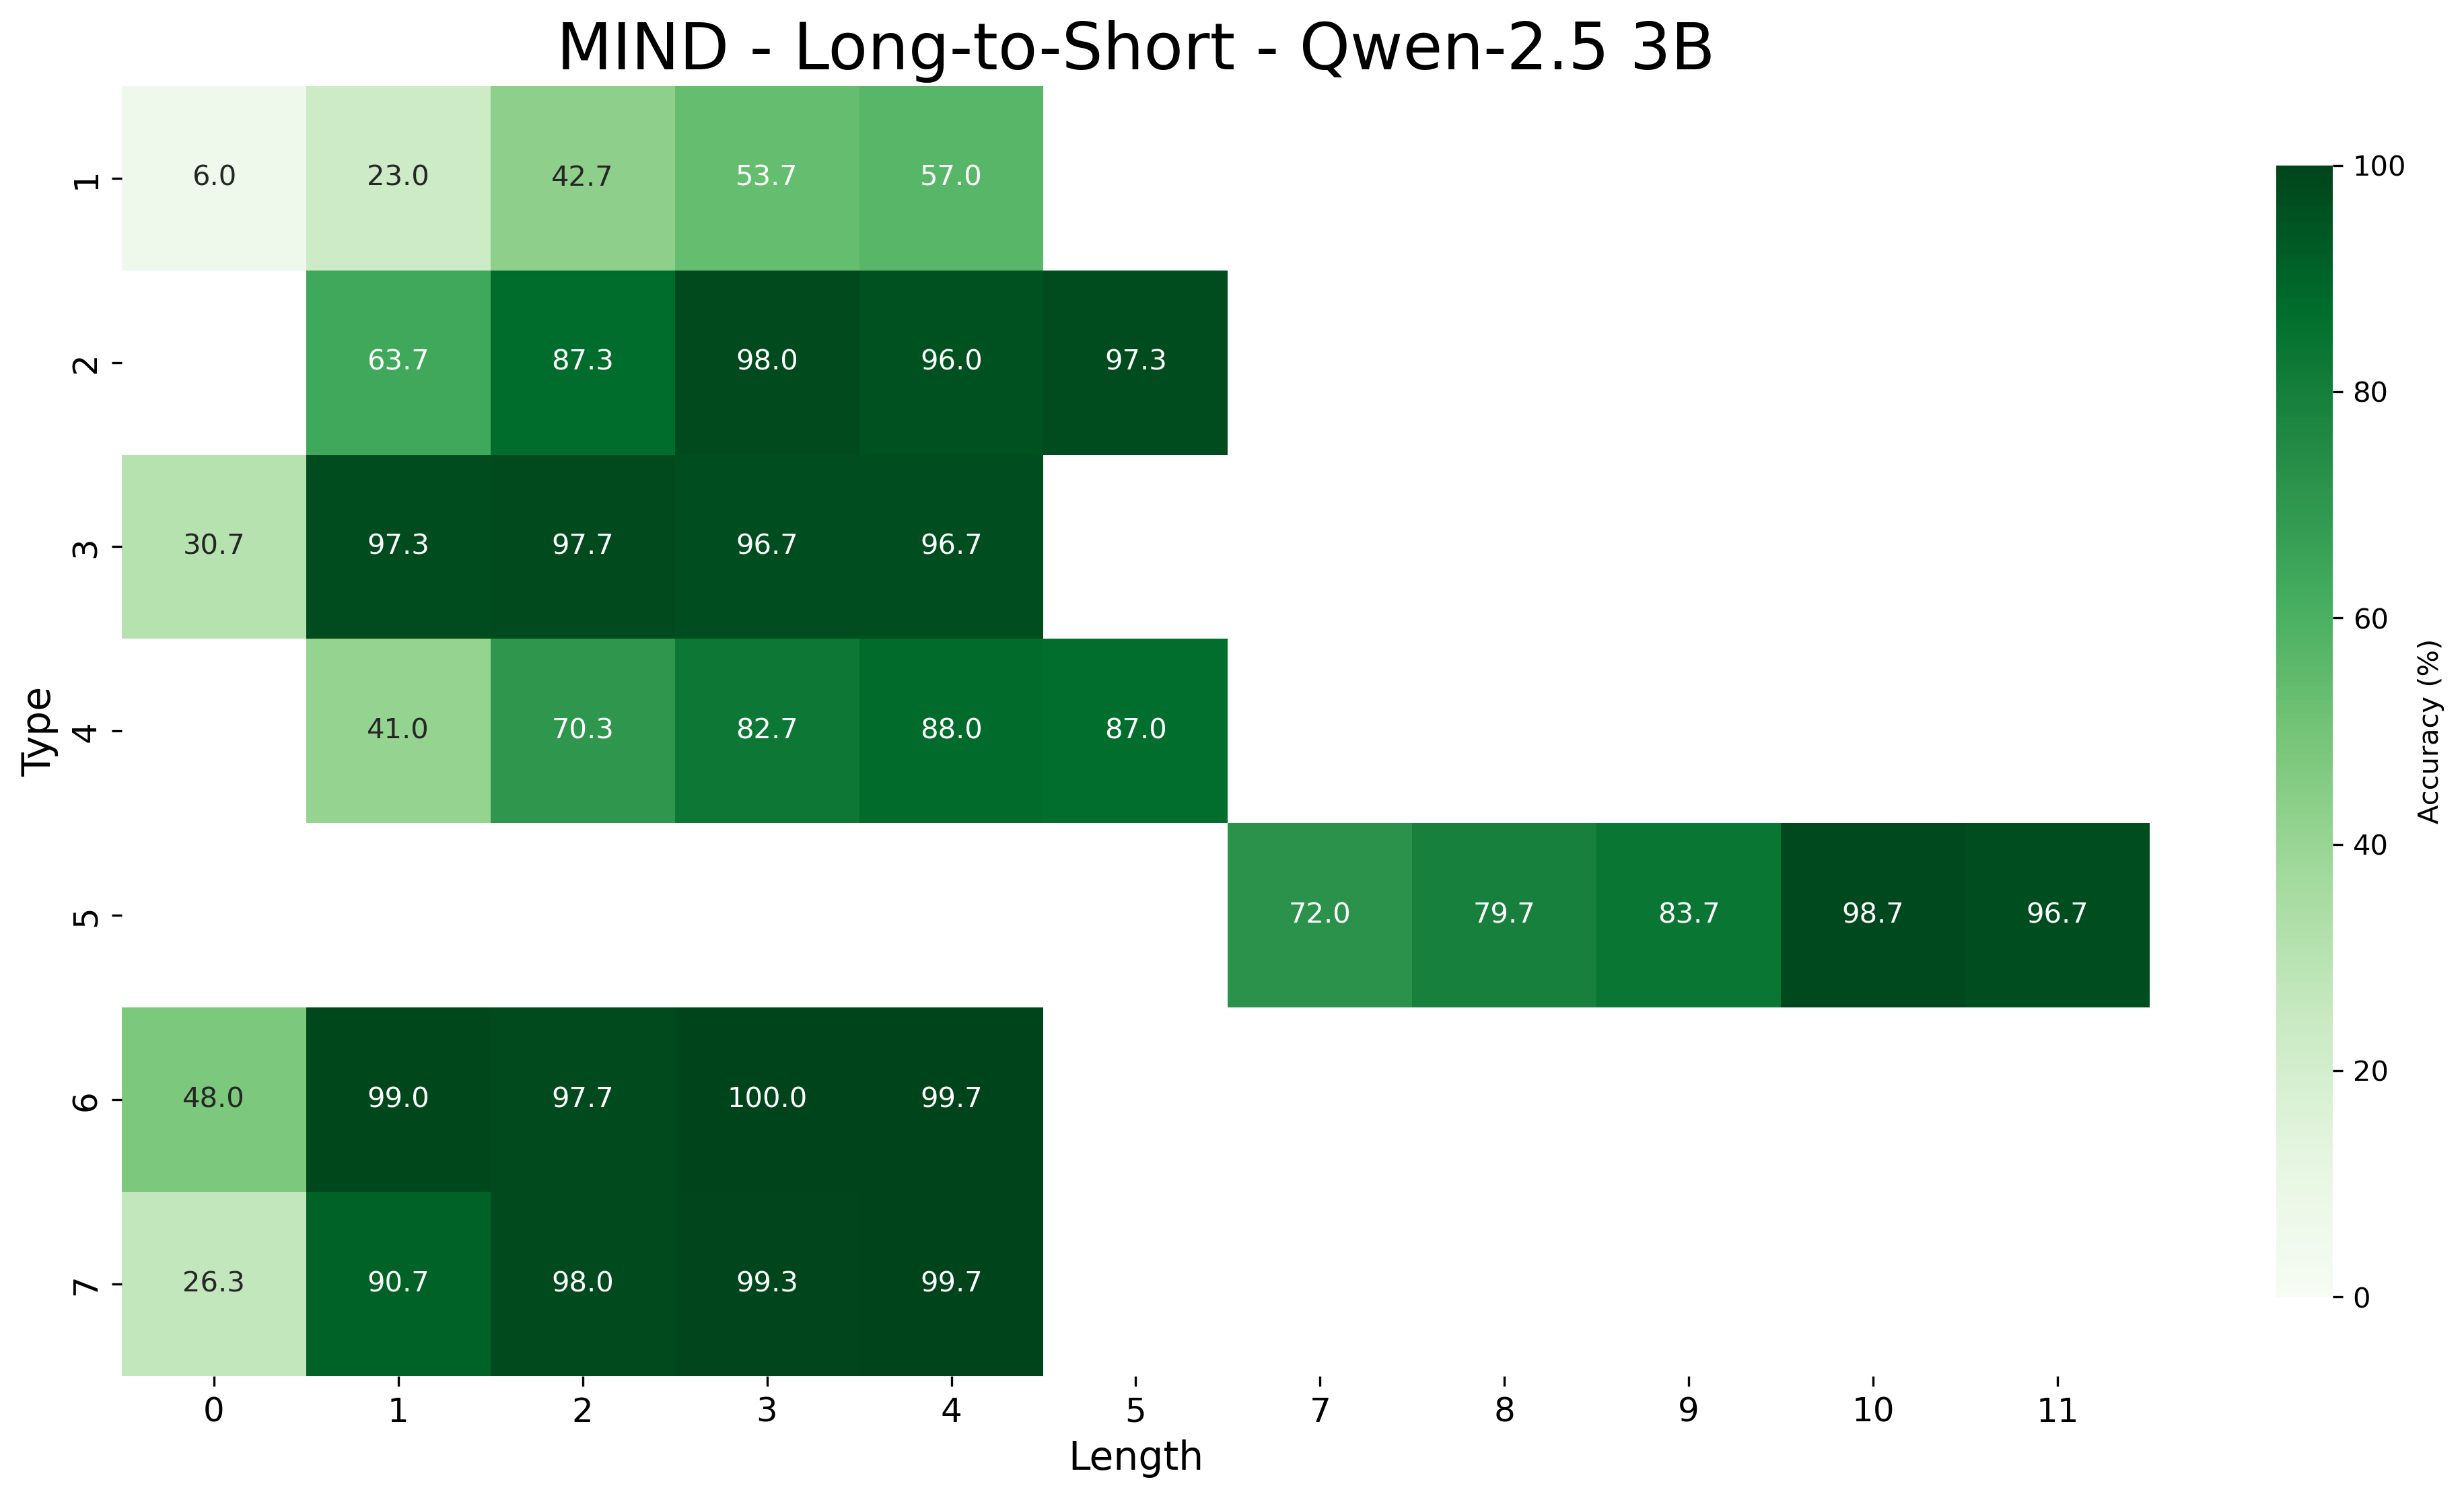
This image is a heatmap visualizing the accuracy performance of a model named "Qwen-2.5 3B" on a task or benchmark referred to as "MIND - Long-to-Short." The chart displays accuracy percentages across two dimensions: "Type" (vertical axis) and "Length" (horizontal axis). The color intensity of each cell represents the accuracy value, with a corresponding color bar legend on the right.
### Components/Axes
* **Title:** "MIND - Long-to-Short - Qwen-2.5 3B" (centered at the top).
* **Vertical Axis (Y-axis):** Labeled "Type," with categorical values numbered 1 through 7.
* **Horizontal Axis (X-axis):** Labeled "Length," with numerical values ranging from 0 to 11. Not all length values are present for every type.
* **Legend/Color Bar:** Located on the right side of the chart. It is a vertical gradient bar labeled "Accuracy (%)" with tick marks at 0, 20, 40, 60, 80, and 100. The color scale runs from a very light green (0%) to a dark forest green (100%).
* **Data Cells:** The main chart area is a grid where each cell's color corresponds to an accuracy value. The exact numerical accuracy is printed within each colored cell.
### Detailed Analysis
The following table reconstructs the data from the heatmap. Empty cells indicate no data point for that Type-Length combination.
| Type | Length 0 | Length 1 | Length 2 | Length 3 | Length 4 | Length 5 | Length 7 | Length 8 | Length 9 | Length 10 | Length 11 |
| :--- | :--- | :--- | :--- | :--- | :--- | :--- | :--- | :--- | :--- | :--- | :--- |
| **1** | 6.0 | 23.0 | 42.7 | 53.7 | 57.0 | | | | | | |
| **2** | | 63.7 | 87.3 | 98.0 | 96.0 | 97.3 | | | | | |
| **3** | 30.7 | 97.3 | 97.7 | 96.7 | 96.7 | | | | | | |
| **4** | | 41.0 | 70.3 | 82.7 | 88.0 | 87.0 | | | | | |
| **5** | | | | | | | 72.0 | 79.7 | 83.7 | 98.7 | 96.7 |
| **6** | 48.0 | 99.0 | 97.7 | 100.0 | 99.7 | | | | | | |
| **7** | 26.3 | 90.7 | 98.0 | 99.3 | 99.7 | | | | | | |
**Trend Verification by Type:**
* **Type 1:** Shows a steady, gradual upward trend in accuracy as Length increases from 0 to 4, starting from a very low base (6.0%).
* **Type 2:** Accuracy jumps sharply from Length 1 (63.7%) to Length 2 (87.3%), then plateaus at a very high level (>96%) for Lengths 3-5.
* **Type 3:** Exhibits a dramatic increase from Length 0 (30.7%) to Length 1 (97.3%), after which accuracy remains consistently high (~97%).
* **Type 4:** Demonstrates a consistent upward trend from Length 1 (41.0%) to Length 4 (88.0%), with a slight decrease at Length 5.
* **Type 5:** Data exists only for longer lengths (7-11). Accuracy shows a general upward trend, with a significant peak at Length 10 (98.7%).
* **Type 6:** Starts with moderate accuracy at Length 0 (48.0%) and immediately jumps to near-perfect scores (>97%) for Lengths 1-4, achieving a perfect 100.0% at Length 3.
* **Type 7:** Similar pattern to Type 6, with a low starting point at Length 0 (26.3%) followed by very high accuracy (>90%) for Lengths 1-4.
### Key Observations
1. **Performance Stratification by Type:** There is a clear hierarchy in model performance across types. Types 2, 3, 6, and 7 achieve very high accuracy (>90%) for most lengths. Type 4 shows good but slightly lower performance. Type 1 is a significant outlier with consistently low accuracy. Type 5 is only evaluated on longer lengths.
2. **Length-Dependent Accuracy:** For nearly all types, accuracy improves as the "Length" value increases. The most dramatic improvements often occur between the first two available data points for a given type (e.g., Type 3 from Length 0 to 1, Type 2 from Length 1 to 2).
3. **Data Sparsity:** The heatmap is not a complete grid. Type 5 has no data for lengths 0-6. Types 2 and 4 lack data for Length 0. This suggests the evaluation was not uniform across all possible Type-Length combinations.
4. **Peak Performance:** The highest accuracy values (98-100%) are concentrated in the darker green cells, primarily for Types 2, 3, 6, and 7 at lengths ≥ 2, and for Type 5 at lengths 10 and 11.
### Interpretation
This heatmap likely evaluates the performance of the Qwen-2.5 3B language model on a "Long-to-Short" text processing task within the MIND framework. The "Type" axis probably represents different categories or difficulty levels of the task, while "Length" likely corresponds to the length of the input or output text (e.g., number of sentences, tokens, or a predefined length bin).
The data suggests the model is highly effective for most task types (2, 3, 6, 7), achieving near-perfect accuracy once a minimum length threshold is met. The poor performance on Type 1 indicates it is a particularly challenging variant of the task. The absence of data for short lengths in Type 5 might imply that this task type is only relevant or defined for longer sequences. The strong positive correlation between length and accuracy for most types implies that the model's ability to perform this "Long-to-Short" task improves when it has more context or a longer target to work with, up to a point of diminishing returns where accuracy plateaus near 100%.