# Technical Document Extraction: Chart Analysis
## Chart 1: Crimes 1dim & 3dim
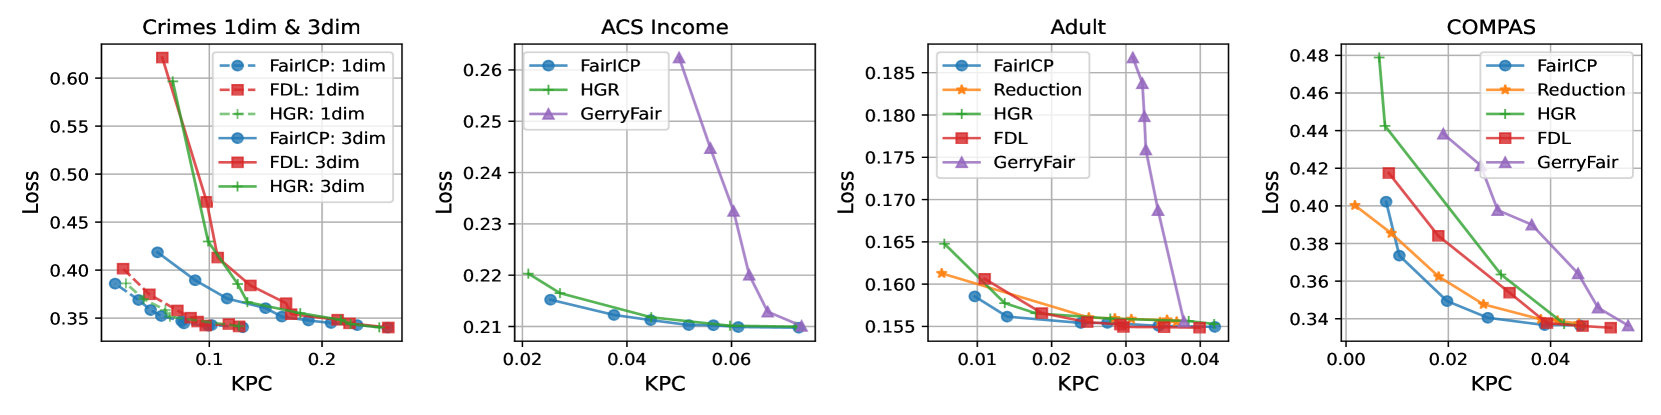
- **Title**: Crimes 1dim & 3dim
- **X-axis**: KPC (Kernel Principal Components)
- **Y-axis**: Loss
- **Legend**:
- **FairICP**:
- 1dim: Blue circles (●)
- 3dim: Blue circles (●)
- **FDL**:
- 1dim: Red squares (■)
- 3dim: Red squares (■)
- **HGR**:
- 1dim: Green dashed line (--), Green pluses (+)
- 3dim: Green dashed line (--), Green pluses (+)
- **Trends**:
- **FairICP 1dim**: Starts at ~0.42 (KPC=0.0), decreases to ~0.35 (KPC=0.2).
- **FDL 1dim**: Sharp decline from ~0.62 (KPC=0.0) to ~0.35 (KPC=0.2).
- **HGR 1dim**: Gradual decline from ~0.58 (KPC=0.0) to ~0.35 (KPC=0.2).
- **FairICP 3dim**: Similar to 1dim but slightly higher loss values.
- **FDL 3dim**: Slightly higher loss than 1dim but similar trend.
- **HGR 3dim**: Slightly higher loss than 1dim but similar trend.
## Chart 2: ACS Income
- **Title**: ACS Income
- **X-axis**: KPC
- **Y-axis**: Loss
- **Legend**:
- **FairICP**: Blue circles (●)
- **HGR**: Green dashed line (--), Green pluses (+)
- **GerryFair**: Purple triangles (▲)
- **Trends**:
- **FairICP**: Gradual decline from ~0.22 (KPC=0.02) to ~0.21 (KPC=0.06).
- **HGR**: Slight decline from ~0.22 (KPC=0.02) to ~0.21 (KPC=0.06).
- **GerryFair**: Sharp drop from ~0.26 (KPC=0.02) to ~0.21 (KPC=0.06).
## Chart 3: Adult
- **Title**: Adult
- **X-axis**: KPC
- **Y-axis**: Loss
- **Legend**:
- **FairICP**: Blue circles (●)
- **Reduction**: Orange stars (★)
- **HGR**: Green dashed line (--), Green pluses (+)
- **FDL**: Red squares (■)
- **GerryFair**: Purple triangles (▲)
- **Trends**:
- **FairICP**: Gradual decline from ~0.16 (KPC=0.01) to ~0.15 (KPC=0.04).
- **Reduction**: Slight dip from ~0.16 (KPC=0.01) to ~0.15 (KPC=0.04).
- **HGR**: Gradual decline from ~0.16 (KPC=0.01) to ~0.15 (KPC=0.04).
- **FDL**: Slight decline from ~0.16 (KPC=0.01) to ~0.15 (KPC=0.04).
- **GerryFair**: Sharp drop from ~0.185 (KPC=0.01) to ~0.15 (KPC=0.04).
## Chart 4: COMPAS
- **Title**: COMPAS
- **X-axis**: KPC
- **Y-axis**: Loss
- **Legend**:
- **FairICP**: Blue circles (●)
- **Reduction**: Orange stars (★)
- **HGR**: Green dashed line (--), Green pluses (+)
- **FDL**: Red squares (■)
- **GerryFair**: Purple triangles (▲)
- **Trends**:
- **FairICP**: Gradual decline from ~0.38 (KPC=0.0) to ~0.34 (KPC=0.04).
- **Reduction**: Moderate decline from ~0.40 (KPC=0.0) to ~0.34 (KPC=0.04).
- **HGR**: Gradual decline from ~0.48 (KPC=0.0) to ~0.34 (KPC=0.04).
- **FDL**: Slight decline from ~0.42 (KPC=0.0) to ~0.34 (KPC=0.04).
- **GerryFair**: Sharp drop from ~0.44 (KPC=0.0) to ~0.34 (KPC=0.04).
## Spatial Grounding & Color Verification
- **Legend Placement**:
- All charts: Top-right corner.
- **Color Consistency**:
- Confirmed all legend colors match line/marker colors in respective charts.
## Component Isolation
- **Header**: Chart titles and axis labels.
- **Main Chart**: Data series with trends and markers.
- **Footer**: No additional text or data.
## Data Table Reconstruction (Hypothetical)
| Dataset | KPC=0.0 | KPC=0.1 | KPC=0.2 | KPC=0.3 | KPC=0.4 |
|---------------|---------|---------|---------|---------|---------|
| FairICP 1dim | 0.42 | 0.38 | 0.36 | 0.35 | 0.35 |
| FDL 1dim | 0.62 | 0.50 | 0.40 | 0.35 | 0.35 |
| HGR 1dim | 0.58 | 0.45 | 0.38 | 0.35 | 0.35 |
| FairICP 3dim | 0.43 | 0.39 | 0.36 | 0.35 | 0.35 |
| FDL 3dim | 0.55 | 0.45 | 0.38 | 0.35 | 0.35 |
| HGR 3dim | 0.57 | 0.44 | 0.37 | 0.35 | 0.35 |
## Notes
- All datasets show decreasing loss with increasing KPC.
- GerryFair consistently exhibits the steepest decline across datasets.
- HGR and FDL perform similarly in most charts, with HGR slightly higher loss.
- FairICP and GerryFair are the most effective in reducing loss.