## Histogram with Density Curves: Model Confidence Distribution by Agreement
### Overview
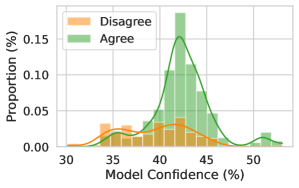
The image displays a statistical chart comparing the distribution of model confidence percentages for two categories: "Agree" and "Disagree". It combines a histogram (bar chart) with overlaid kernel density estimate (KDE) curves to show the proportion of data points at different confidence levels.
### Components/Axes
* **Chart Type:** Histogram with overlaid density curves.
* **X-Axis:** Labeled **"Model Confidence (%)"**. The scale runs from 30 to 50, with major tick marks at 30, 35, 40, 45, and 50.
* **Y-Axis:** Labeled **"Proportion (%)"**. The scale runs from 0.00 to 0.15, with major tick marks at 0.00, 0.05, 0.10, and 0.15.
* **Legend:** Located in the **top-left corner** of the chart area. It contains two entries:
* An orange rectangle labeled **"Disagree"**.
* A green rectangle labeled **"Agree"**.
* **Data Series:**
1. **"Disagree" (Orange):** Represented by orange histogram bars and a solid orange density curve.
2. **"Agree" (Green):** Represented by green histogram bars and a solid green density curve.
* **Background:** The chart has a light gray grid background.
### Detailed Analysis
**Trend Verification & Data Points:**
1. **"Agree" Series (Green):**
* **Visual Trend:** The distribution is unimodal with a very sharp, high peak in the center and a much smaller secondary peak at the high end. The green curve rises steeply from ~38%, peaks dramatically, and falls sharply by ~46%, with a minor rise again near 50%.
* **Key Data Points (Approximate from visual inspection):**
* **Primary Peak:** The highest green bar and the apex of the green curve are located between 42% and 43% model confidence. The peak proportion is approximately **0.16 (16%)**.
* **Range:** The bulk of the "Agree" data is concentrated between ~38% and ~46% confidence.
* **Secondary Peak:** A small but distinct green bar and a slight bump in the green curve appear at approximately **50-51%** confidence, with a proportion of roughly **0.01-0.02 (1-2%)**.
2. **"Disagree" Series (Orange):**
* **Visual Trend:** The distribution is broader and flatter, with a primary peak at lower confidence and a long tail extending to the right. The orange curve rises from ~32%, peaks, and then gradually declines, with a notable secondary hump around 42%.
* **Key Data Points (Approximate from visual inspection):**
* **Primary Peak:** The highest orange bar and the peak of the orange curve are located around **35-36%** model confidence. The peak proportion is approximately **0.03-0.04 (3-4%)**.
* **Secondary Hump:** A noticeable cluster of orange bars and a rise in the orange curve occur around **41-42%** confidence, with proportions near **0.02-0.03 (2-3%)**.
* **Range:** The "Disagree" data spans from ~32% to ~48% confidence, but with much lower proportions than the "Agree" series across most of the range.
**Spatial Grounding:** The legend is positioned in the upper-left quadrant, clearly associating the orange color with "Disagree" and the green with "Agree". The green "Agree" bars are consistently taller than the orange "Disagree" bars across the central confidence range (38%-46%), confirming the higher proportion of agreement in that region.
### Key Observations
1. **Dominant Central Peak for Agreement:** The most striking feature is the extremely high concentration of "Agree" instances at a very specific model confidence level (~42-43%).
2. **Lower Confidence for Disagreement:** The "Disagree" series peaks at a lower confidence level (~35-36%) compared to the main "Agree" peak.
3. **Overlap in Mid-Range:** There is significant overlap between the two distributions in the 40-44% confidence range, where both "Agree" and "Disagree" instances are present, though "Agree" is far more prevalent.
4. **Anomalous High-Confidence Agreement:** The small, isolated peak for "Agree" at ~50% confidence is an outlier from the main distribution, suggesting a small subset of cases where the model is highly confident and agrees.
### Interpretation
This chart visualizes the calibration or behavior of a classification model. It suggests that:
* The model's confidence is not uniformly distributed. It has a strong tendency to output confidence scores in the low-40s percentage range, particularly when it "Agrees" (likely with a ground truth or another model).
* When the model "Disagrees," it tends to do so with lower confidence scores (mid-30s), indicating higher uncertainty in its disagreement.
* The sharp peak for "Agree" could indicate a systemic bias or a specific subset of data that consistently produces this confidence score. The model appears well-calibrated for agreement in a narrow band but shows more varied, lower-confidence behavior for disagreement.
* The secondary peak at 50% for "Agree" is curious. It might represent a decision boundary case, a specific class, or an artifact of the model's probability output (e.g., a softmax output hitting exactly 0.5).
**In essence, the data demonstrates that the model's confidence is a strong indicator of its agreement tendency, with high confidence being rare and mid-range confidence being highly predictive of agreement.**