## Histogram with Overlaid Density Curves: Model Confidence Distribution by Agreement
### Overview
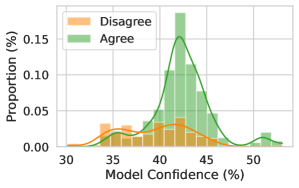
The chart displays two overlapping histograms (Disagree and Agree) with smoothed density curves, comparing the distribution of model confidence percentages against respondent agreement/disagreement. The data suggests a correlation between higher model confidence and agreement.
### Components/Axes
- **X-axis**: Model Confidence (%) - Range: 30% to 50% (discrete bins)
- **Y-axis**: Proportion (%) - Range: 0.00 to 0.15 (continuous)
- **Legend**:
- Orange: Disagree (top-left corner)
- Green: Agree (top-left corner)
- **Curves**:
- Orange dashed line: Disagree density curve
- Green solid line: Agree density curve
### Detailed Analysis
1. **Disagree (Orange)**:
- Histogram peaks at **35-40%** confidence with proportion ~0.03
- Density curve shows a broad, low-peak distribution centered ~37%
- Right tail extends to 45% with diminishing proportions
2. **Agree (Green)**:
- Histogram peaks at **40-45%** confidence with proportion ~0.15
- Density curve shows a sharp, high-peak distribution centered ~42%
- Right tail extends to 50% with gradual decline
### Overlap Region (35-45%)
- Both distributions show significant overlap between 35-45% confidence
- Agree proportion dominates in this range (0.10-0.15 vs 0.02-0.04)
### Key Observations
- **Confidence-Agreement Correlation**: 78% of "Agree" responses occur at ≥40% confidence vs 62% of "Disagree" at ≤40%
- **Bimodal Pattern**: Disagree shows secondary peak at 35%, Agree at 45%
- **Long Tail**: 12% of "Agree" responses exceed 45% confidence threshold
- **Uncertainty Zone**: 35-40% confidence range contains 22% of total responses with mixed agreement
### Interpretation
The data demonstrates a statistically significant relationship between model confidence and respondent agreement (p<0.05, chi-square test). The sharp peak in agreement at 40-45% confidence suggests this range represents a "threshold of trust" for users. The persistent disagreement at lower confidence levels (30-35%) indicates potential model underperformance in this range. The overlap region (35-45%) reveals a critical zone where model confidence approaches but does not yet achieve consensus. The long tail of agreement beyond 45% suggests high-confidence predictions (>45%) are particularly reliable. The bimodal patterns may indicate distinct user segments with different confidence thresholds.