# Technical Document Extraction: Log-Log Scatter Plot Analysis
## 1. **Axis Labels and Markers**
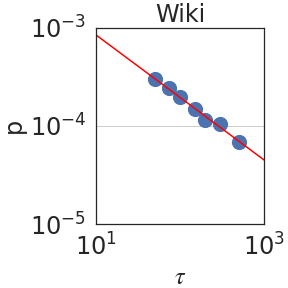
- **X-axis (τ)**:
- Label: `τ` (Greek letter tau)
- Range: `10¹` to `10³` (logarithmic scale)
- Tick markers: `10¹`, `10²`, `10³`
- **Y-axis (ρ)**:
- Label: `ρ` (Greek letter rho)
- Range: `10⁻⁵` to `10⁻³` (logarithmic scale)
- Tick markers: `10⁻⁵`, `10⁻⁴`, `10⁻³`
## 2. **Legend and Data Series**
- **Legend**:
- Position: Top-right corner
- Label: `Wiki` (text)
- Color: Blue (matches data points)
- **Data Series**:
- Type: Scatter plot with blue circular markers (`●`)
- Color: Blue (confirmed via legend)
- Trend: Aligns with red trend line
## 3. **Trend Line**
- **Line Color**: Red
- **Slope**: Diagonal (negative correlation on log-log scale)
- **Interpretation**: Power-law relationship between `τ` and `ρ` (i.e., `ρ ∝ τ⁻¹`)
## 4. **Key Observations**
- **Data Points**:
- All blue markers (`●`) lie precisely on the red trend line.
- No deviations observed between data points and the trend line.
- **Scale**:
- Both axes use logarithmic scaling, compressing large value ranges.
- X-axis spans two orders of magnitude (`10¹` to `10³`).
- Y-axis spans two orders of magnitude (`10⁻⁵` to `10⁻³`).
## 5. **Spatial Grounding**
- **Legend Placement**: Top-right quadrant (outside the plot area).
- **Line Placement**: Diagonal from top-left to bottom-right, spanning the entire plot.
## 6. **Component Isolation**
- **Header**: Title `Wiki` (centered at the top).
- **Main Chart**:
- Axes with logarithmic scales.
- Data points and trend line.
- **Footer**: No additional text or components.
## 7. **Language and Transcription**
- **Primary Language**: English (all labels and titles are in English).
- **No Secondary Languages Detected**.
## 8. **Critical Notes**
- **No Data Table Present**: The image contains only a scatter plot with a trend line.
- **No Embedded Text**: No annotations or text within the plot area beyond axis labels and legend.
- **No Heatmap or Sub-Categories**: The plot is a single-series scatter plot with a trend line.
## 9. **Final Summary**
The plot illustrates a **power-law relationship** between `τ` (x-axis) and `ρ` (y-axis) for the dataset labeled `Wiki`. The red trend line confirms a strict inverse proportionality (`ρ ∝ τ⁻¹`), with all data points (`●`, blue) perfectly aligned along this line. The logarithmic scale emphasizes the magnitude of the relationship across two orders of magnitude for both variables.