\n
## Diagram: Knowledge Graph Iteration
### Overview
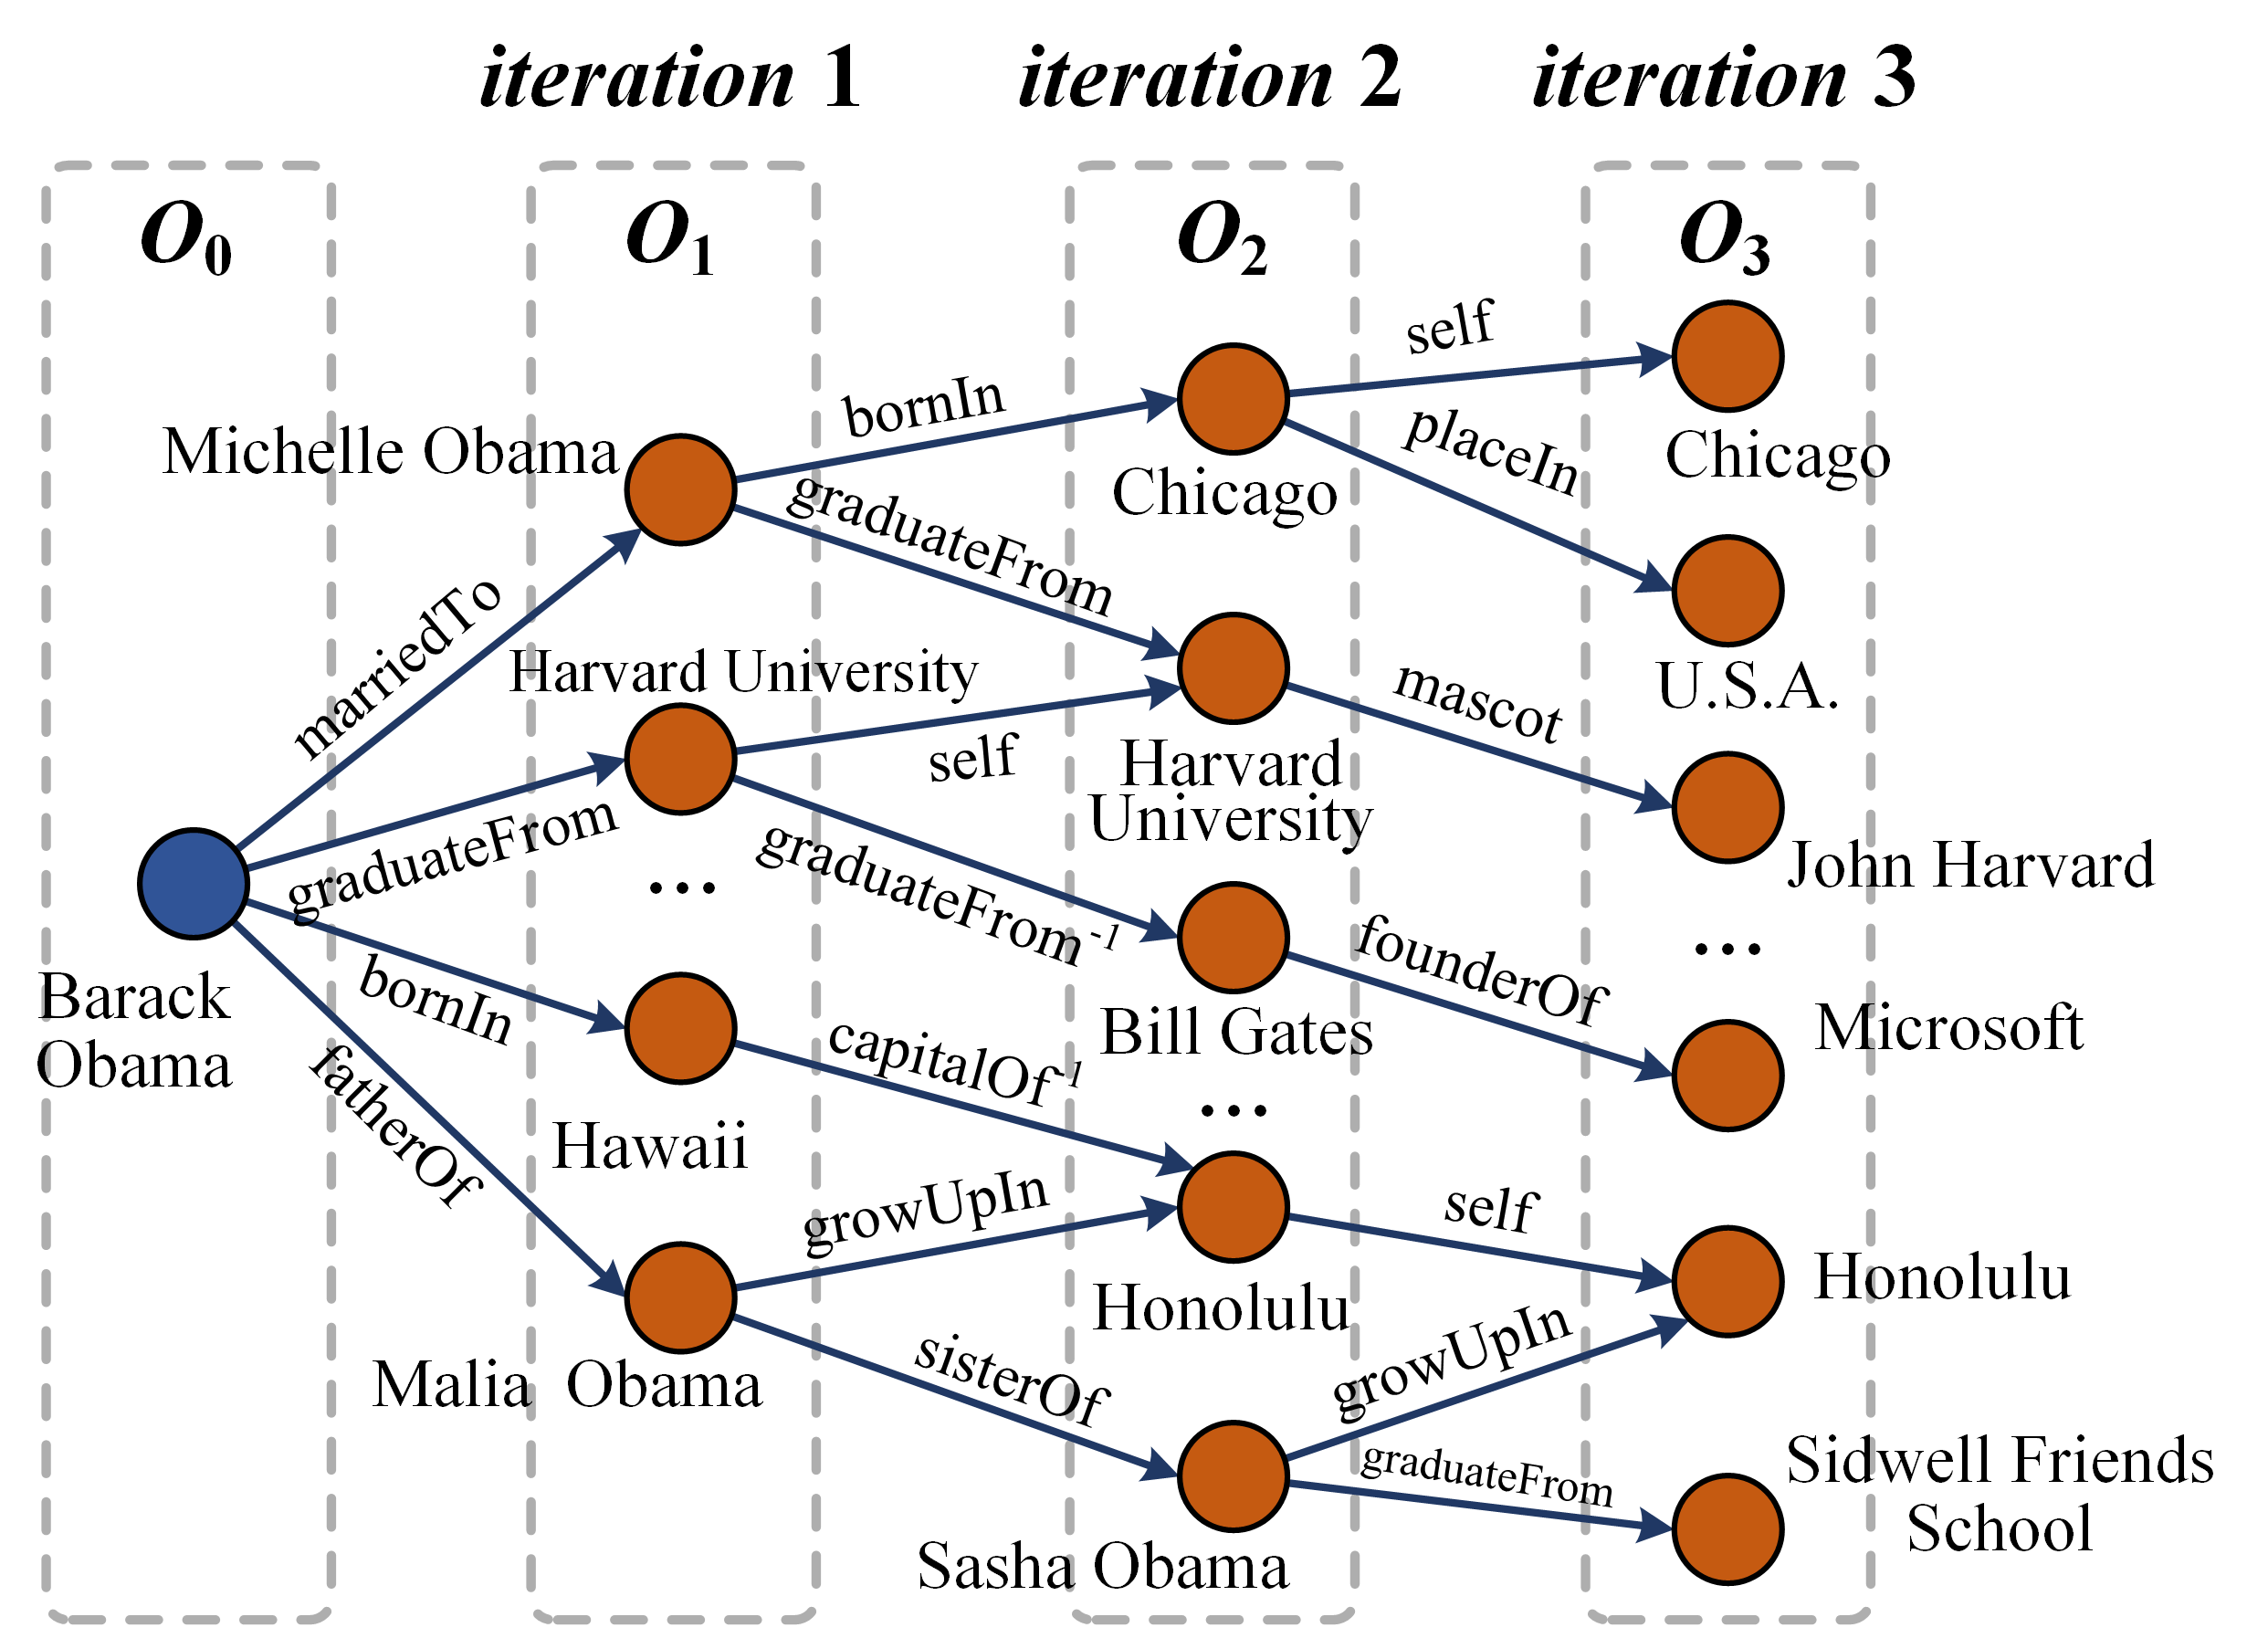
The image depicts a knowledge graph evolving through three iterations (O₀, O₁, O₂, O₃). Each iteration adds new nodes and relationships to the graph, representing an expanding knowledge base. The graph focuses on entities related to Barack Obama, his family, Harvard University, and related locations and people. The diagram uses nodes to represent entities and directed edges to represent relationships between them.
### Components/Axes
The diagram is divided into four vertical sections labeled "iteration 1" (O₀), "iteration 2" (O₁), "iteration 3" (O₂), and "iteration 3" (O₃), demarcated by dashed vertical lines. Each section represents a stage in the knowledge graph's development. The nodes are colored orange or blue. Edges are blue and labeled with the type of relationship they represent.
### Detailed Analysis or Content Details
**Iteration 1 (O₀):**
* **Nodes:** Michelle Obama, Barack Obama, Harvard University, Malia Obama.
* **Relationships:**
* Barack Obama `marriedTo` Michelle Obama.
* Barack Obama `graduateFrom` Harvard University.
* Barack Obama `bornIn` Hawaii.
* Barack Obama `fatherOf` Malia Obama.
**Iteration 2 (O₁):**
* **Nodes:** Adds Chicago, Hawaii, Honolulu, Sasha Obama.
* **Relationships:**
* Michelle Obama `bornIn` Chicago.
* Michelle Obama `graduateFrom` Harvard University.
* Harvard University `self` Harvard University (self-loop).
* Harvard University `graduateFrom` Bill Gates.
* Bill Gates `capitalOf` Hawaii.
* Malia Obama `sisterOf` Sasha Obama.
* Sasha Obama `growUpIn` Honolulu.
**Iteration 3 (O₂):**
* **Nodes:** Adds U.S.A., John Harvard, Microsoft, Sidwell Friends School.
* **Relationships:**
* Chicago `self` Chicago (self-loop).
* Harvard University `mascot` U.S.A.
* U.S.A. `placeIn` Chicago.
* John Harvard `founderOf` Microsoft.
* Microsoft `...` (truncated).
* Honolulu `self` Honolulu (self-loop).
* Sasha Obama `graduateFrom` Sidwell Friends School.
* Sidwell Friends School `growUpIn` Honolulu.
**Iteration 3 (O₃):**
* **Nodes:** Re-emphasizes Chicago, John Harvard, Honolulu, Microsoft.
* **Relationships:** No new relationships are added in this iteration, it appears to be a restatement of the previous iteration.
### Key Observations
* The graph expands iteratively, adding new entities and relationships with each step.
* The relationships are directional, indicating the nature of the connection between entities.
* Self-loops are used to indicate properties of entities (e.g., Harvard University `self` Harvard University).
* The graph demonstrates a growing knowledge base centered around Barack Obama and his connections.
* The "..." notation suggests that the graph could be even more extensive, with relationships potentially extending beyond what is shown.
### Interpretation
This diagram illustrates the concept of knowledge graph construction and evolution. Each iteration represents a refinement of the knowledge base, adding more information and connections. The graph demonstrates how entities can be linked through various relationships, creating a network of knowledge. The iterative process suggests a learning or discovery process, where new information is incorporated into the existing knowledge base. The use of self-loops indicates that entities can have properties or relationships with themselves. The truncation ("...") suggests that the graph is not exhaustive and could be expanded further. The diagram is a visual representation of semantic relationships, which are fundamental to knowledge representation and reasoning. The diagram is not presenting data in a quantitative sense, but rather demonstrating a qualitative expansion of a knowledge base.