## Knowledge Graph Diagram: Iterative Expansion from Barack Obama
### Overview
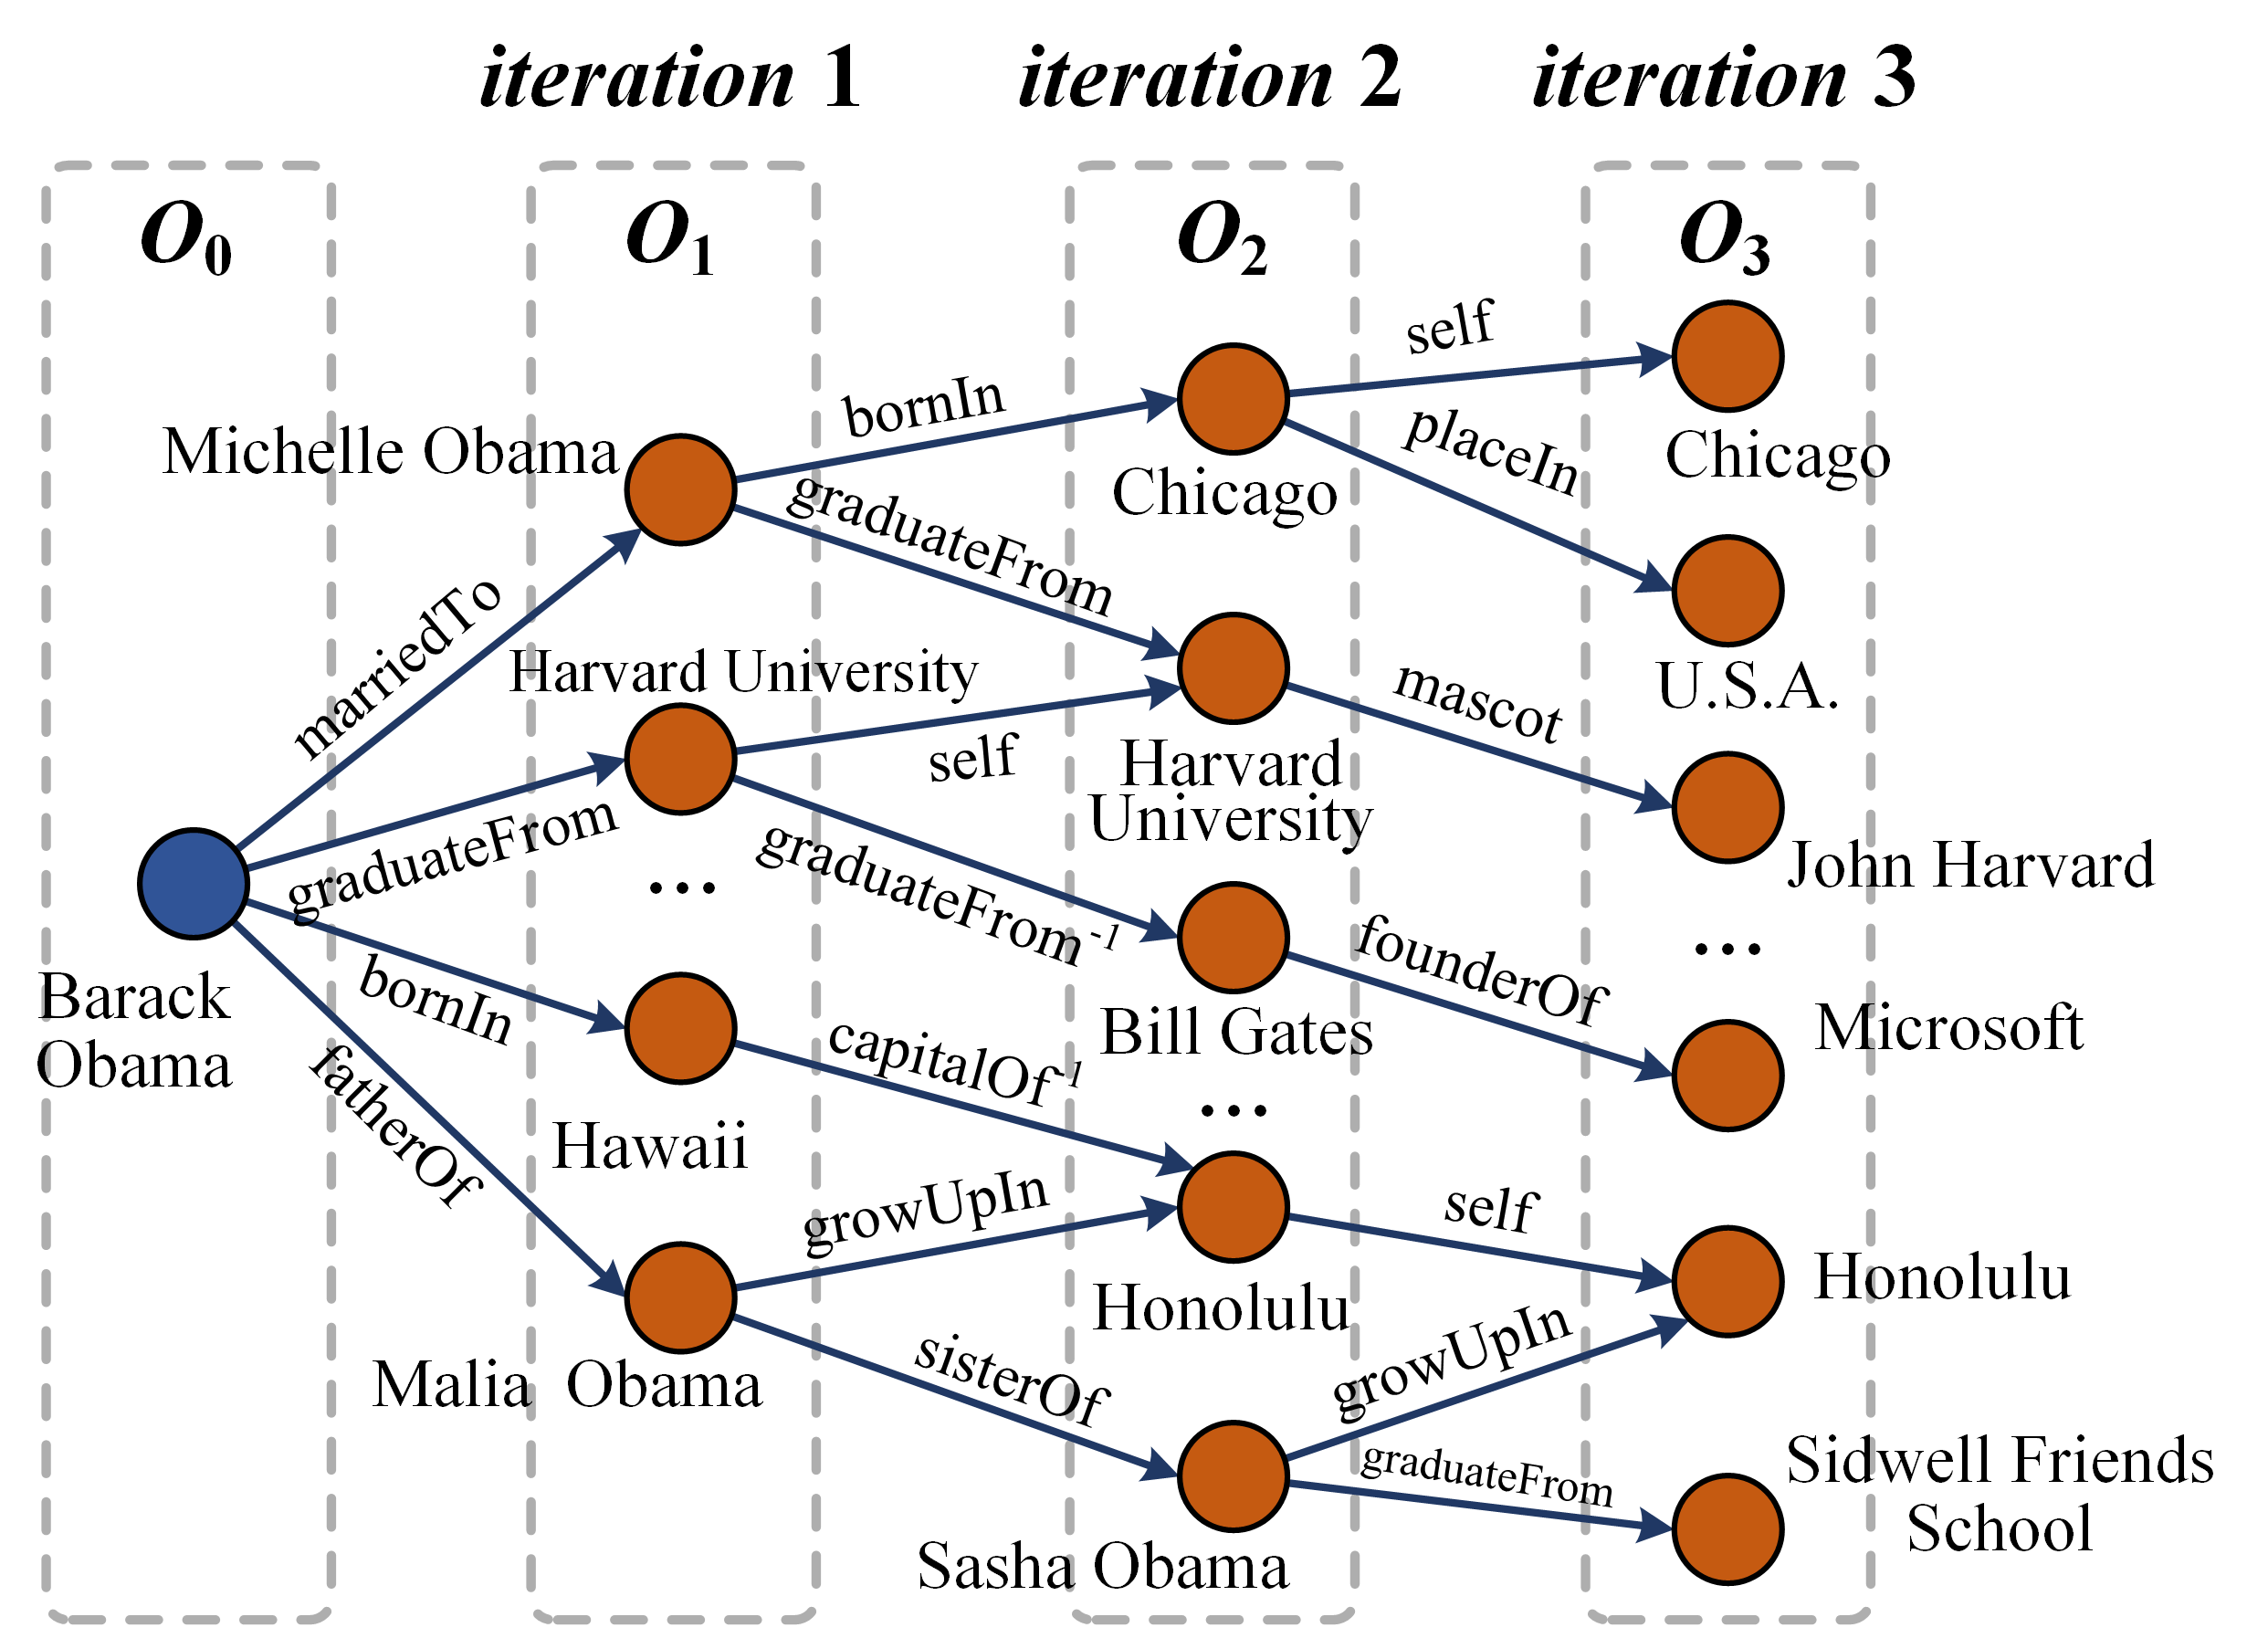
The image displays a directed graph illustrating the iterative expansion of a knowledge graph starting from a central entity, "Barack Obama." The graph is organized into four vertical, dashed-line boxes representing sequential iterations (O₀ to O₃). Nodes are circles, and relationships are represented by labeled, directed arrows. The diagram demonstrates how a knowledge base can be traversed or expanded to discover connected entities and facts.
### Components/Axes
* **Structure:** Four vertical columns, each enclosed in a gray dashed rectangle, labeled at the top:
* **O₀** (Iteration 0): The starting point.
* **O₁** (Iteration 1): First-hop connections.
* **O₂** (Iteration 2): Second-hop connections.
* **O₃** (Iteration 3): Third-hop connections.
* **Nodes:** Represent entities. They are colored circles.
* **Blue Node:** "Barack Obama" (located in O₀).
* **Orange Nodes:** All other entities (located in O₁, O₂, and O₃).
* **Edges:** Represent relationships. They are dark blue arrows with text labels indicating the relationship type. Some labels include a superscript "-1" (e.g., `graduateFrom⁻¹`), likely indicating an inverse relationship.
* **Text Labels:** All entity names and relationship types are in English.
### Detailed Analysis
The graph expands from left to right. Below is a complete reconstruction of all visible nodes and their connecting edges, organized by iteration column.
**Iteration O₀ (Leftmost Column):**
* **Node:** `Barack Obama` (Blue circle).
* **Outgoing Edges:**
1. `marriedTo` → `Michelle Obama` (in O₁).
2. `graduateFrom` → `Harvard University` (in O₁).
3. `bornIn` → `Hawaii` (in O₁).
4. `fatherOf` → `Malia Obama` (in O₁).
**Iteration O₁ (Second Column):**
* **Nodes & Their Outgoing Edges:**
1. `Michelle Obama`:
* `bornIn` → `Chicago` (in O₂).
* `graduateFrom` → `Harvard University` (in O₂).
2. `Harvard University`:
* `self` → `Harvard University` (in O₂). *[This appears to be a self-loop or identity link]*
* `graduateFrom⁻¹` → `Bill Gates` (in O₂). *[Inverse of "graduateFrom"]*
3. `Hawaii`:
* `capitalOf⁻¹` → `Honolulu` (in O₂). *[Inverse of "capitalOf"]*
4. `Malia Obama`:
* `growUpIn` → `Honolulu` (in O₂).
* `sisterOf` → `Sasha Obama` (in O₂).
5. `Sasha Obama` (Node is present, but no outgoing edges are drawn from it in this column).
* **Ellipsis (`...`):** Indicates additional, unshown nodes in this iteration.
**Iteration O₂ (Third Column):**
* **Nodes & Their Outgoing Edges:**
1. `Chicago`:
* `self` → `Chicago` (in O₃).
* `placeIn` → `U.S.A.` (in O₃).
2. `Harvard University`:
* `mascot` → `John Harvard` (in O₃).
3. `Bill Gates`:
* `founderOf` → `Microsoft` (in O₃).
4. `Honolulu`:
* `self` → `Honolulu` (in O₃).
5. `Sasha Obama`:
* `growUpIn` → `Honolulu` (in O₃).
* `graduateFrom` → `Sidwell Friends School` (in O₃).
* **Ellipsis (`...`):** Indicates additional, unshown nodes in this iteration.
**Iteration O₃ (Rightmost Column):**
* **Nodes (Terminal in this diagram):**
* `Chicago`
* `U.S.A.`
* `John Harvard`
* `Microsoft`
* `Honolulu`
* `Sidwell Friends School`
* No outgoing edges are drawn from nodes in this column.
### Key Observations
1. **Iterative Expansion:** The graph clearly models a multi-hop traversal process, where each iteration reveals entities one relationship step further from the origin.
2. **Relationship Semantics:** Relationships are specific and typed (e.g., `marriedTo`, `bornIn`, `founderOf`). The use of `self` edges in O₂→O₃ for locations (`Chicago`, `Honolulu`) may indicate a canonicalization or identity resolution step.
3. **Inverse Relationships:** The presence of `graduateFrom⁻¹` and `capitalOf⁻¹` edges is notable. This suggests the knowledge graph or traversal algorithm can reason about and follow relationships in reverse (e.g., from a university to its alumni, or from a state to its capital).
4. **Entity Color Coding:** The single blue node (`Barack Obama`) versus all orange nodes visually distinguishes the query or seed entity from the discovered entities.
5. **Incomplete Graph:** The ellipses (`...`) in O₁ and O₂ explicitly indicate that the shown graph is a subset of a larger, more complete knowledge base.
### Interpretation
This diagram is a pedagogical or technical illustration of **knowledge graph traversal** or **link prediction**. It demonstrates how a system can start with a known entity (Barack Obama) and, by following a chain of relationships, uncover a web of connected facts about people, places, institutions, and their interrelations.
The progression from O₀ to O₃ shows the exponential growth of discoverable information with each hop. The inclusion of inverse relationships (`⁻¹`) is a key technical detail, highlighting that advanced graph algorithms don't just follow edges forward but can also reason backwards to infer new connections (e.g., "Bill Gates is an alumnus of Harvard" is inferred via the inverse of "Harvard has alumnus Bill Gates").
The "self" edges are particularly interesting. They might represent a step where an entity is confirmed or linked to its canonical representation in the knowledge base, ensuring consistency across iterations. Overall, the diagram effectively communicates the power and methodology of structured knowledge representation and reasoning, showing how a single fact can be a gateway to a vast network of related information.