## Line Chart: Mean Error over Time
### Overview
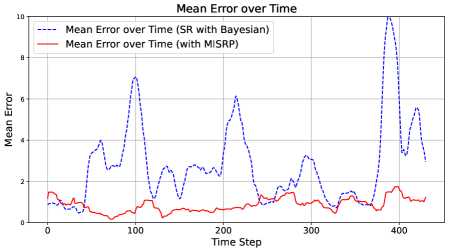
The image is a line chart comparing the mean error over time for two different methods: "SR with Bayesian" and "with MISRP". The x-axis represents the time step, and the y-axis represents the mean error. The chart displays how the mean error fluctuates over time for each method.
### Components/Axes
* **Title:** Mean Error over Time
* **X-axis:**
* Label: Time Step
* Scale: 0 to 400, with visible markers at 0, 100, 200, 300, and 400.
* **Y-axis:**
* Label: Mean Error
* Scale: 0 to 10, with visible markers at 0, 2, 4, 6, 8, and 10.
* **Legend:** Located in the top-left corner.
* Blue dashed line: Mean Error over Time (SR with Bayesian)
* Red solid line: Mean Error over Time (with MISRP)
### Detailed Analysis
* **Mean Error over Time (SR with Bayesian):** (Blue dashed line)
* Trend: Highly variable, with several peaks and troughs.
* Data Points:
* Starts around 1.5 at time step 0.
* Peaks around 7 at time step 100.
* Dips to approximately 1.5 around time step 150.
* Rises to approximately 4 around time step 200.
* Fluctuates between 1.5 and 3.5 between time steps 200 and 350.
* Peaks sharply to approximately 9.5 around time step 390.
* Drops to approximately 3 around time step 410.
* Rises again to approximately 6 around time step 420.
* **Mean Error over Time (with MISRP):** (Red solid line)
* Trend: Relatively stable, with minor fluctuations.
* Data Points:
* Starts around 1.5 at time step 0.
* Dips to approximately 0.5 around time step 50.
* Rises to approximately 1.2 around time step 100.
* Remains relatively stable between 0.5 and 1.5 from time step 100 to 400.
* Rises slightly to approximately 1.5 at time step 400.
### Key Observations
* The "SR with Bayesian" method exhibits significantly higher variability in mean error compared to the "with MISRP" method.
* The "SR with Bayesian" method experiences several sharp peaks in mean error, indicating periods of instability or poor performance.
* The "with MISRP" method maintains a relatively low and stable mean error throughout the observed time period.
### Interpretation
The chart suggests that the "with MISRP" method is more stable and reliable in terms of mean error compared to the "SR with Bayesian" method. The "SR with Bayesian" method, while potentially capable of achieving low error at times, is prone to significant fluctuations and occasional spikes in error. This could indicate that the "with MISRP" method is more robust to changes in the environment or input data. The "SR with Bayesian" method may require more careful tuning or adaptation to maintain consistent performance.