## Line Chart: Mean Error over Time
### Overview
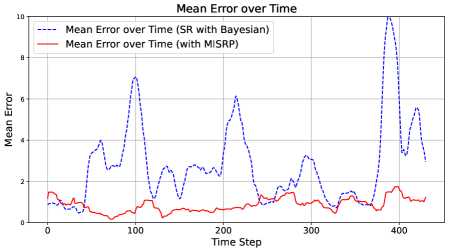
The image presents a line chart illustrating the "Mean Error over Time" for two different methods: "SR with Bayesian" and "with MISRP". The chart displays how the mean error fluctuates across time steps, allowing for a comparison of the performance of the two methods.
### Components/Axes
* **Title:** "Mean Error over Time" (centered at the top)
* **X-axis:** "Time Step" (ranging from approximately 0 to 450, with tick marks at intervals of 50)
* **Y-axis:** "Mean Error" (ranging from 0 to 10, with tick marks at intervals of 2)
* **Legend:** Located in the top-left corner.
* "Mean Error over Time (SR with Bayesian)" - represented by a dashed blue line.
* "Mean Error over Time (with MISRP)" - represented by a solid red line.
### Detailed Analysis
**SR with Bayesian (Blue Dashed Line):**
The blue line exhibits significant fluctuations throughout the time steps. It generally starts around a mean error of 1.5 at Time Step 0. The line increases to a peak of approximately 7 at Time Step 80, then decreases to around 2 at Time Step 150. It rises again to a peak of approximately 6 at Time Step 200, followed by a decline to around 2 at Time Step 300. The line then fluctuates between 2 and 4 until Time Step 400, where it spikes to approximately 10, and then decreases to around 5 at Time Step 450.
* Time Step 0: Mean Error ≈ 1.5
* Time Step 50: Mean Error ≈ 2.5
* Time Step 80: Mean Error ≈ 7.0
* Time Step 100: Mean Error ≈ 3.0
* Time Step 150: Mean Error ≈ 2.0
* Time Step 200: Mean Error ≈ 6.0
* Time Step 250: Mean Error ≈ 3.0
* Time Step 300: Mean Error ≈ 2.0
* Time Step 350: Mean Error ≈ 3.0
* Time Step 400: Mean Error ≈ 10.0
* Time Step 450: Mean Error ≈ 5.0
**with MISRP (Red Solid Line):**
The red line shows a much more stable pattern with lower mean error values compared to the blue line. It starts around a mean error of 1 at Time Step 0 and generally fluctuates between 1 and 2.5 throughout the majority of the time steps. There is a slight increase around Time Step 250, reaching approximately 2.5, and another around Time Step 400, reaching approximately 2.7.
* Time Step 0: Mean Error ≈ 1.0
* Time Step 50: Mean Error ≈ 1.2
* Time Step 100: Mean Error ≈ 1.5
* Time Step 150: Mean Error ≈ 1.8
* Time Step 200: Mean Error ≈ 2.0
* Time Step 250: Mean Error ≈ 2.5
* Time Step 300: Mean Error ≈ 1.5
* Time Step 350: Mean Error ≈ 1.7
* Time Step 400: Mean Error ≈ 2.7
* Time Step 450: Mean Error ≈ 2.3
### Key Observations
* The "SR with Bayesian" method exhibits significantly higher and more volatile mean error values compared to the "with MISRP" method.
* The "with MISRP" method maintains a relatively stable and low mean error throughout the observed time steps.
* There is a large spike in the mean error for the "SR with Bayesian" method at Time Step 400, indicating a potential issue or outlier event.
### Interpretation
The chart demonstrates that the "with MISRP" method consistently outperforms the "SR with Bayesian" method in terms of minimizing mean error over time. The "SR with Bayesian" method is prone to larger errors and greater fluctuations, suggesting it may be less robust or sensitive to certain conditions. The spike at Time Step 400 for the "SR with Bayesian" method warrants further investigation to understand the cause of this significant error increase. The consistent low error of the MISRP method suggests it is a more reliable and stable approach for this particular task. The data suggests that the MISRP method is a better choice for minimizing error in this context.