## Line Graph: Mean Error over Time
### Overview
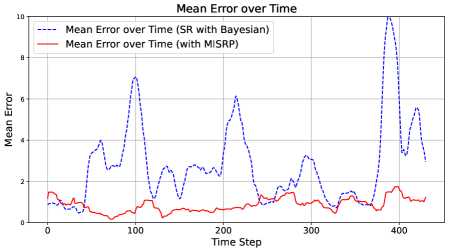
The image is a line graph comparing two methods for tracking mean error over time: "SR with Bayesian" (dashed blue line) and "MISRP" (solid red line). The x-axis represents time steps (0–400), and the y-axis represents mean error (0–10). The graph highlights significant fluctuations in error for both methods, with distinct patterns of spikes and stability.
### Components/Axes
- **Title**: "Mean Error over Time"
- **X-axis**: "Time Step" (0–400, linear scale)
- **Y-axis**: "Mean Error" (0–10, linear scale)
- **Legend**: Located in the top-left corner, with two entries:
- Dashed blue line: "Mean Error over Time (SR with Bayesian)"
- Solid red line: "Mean Error over Time (with MISRP)"
### Detailed Analysis
1. **SR with Bayesian (Blue Dashed Line)**:
- **Trend**: Exhibits frequent and pronounced spikes in error.
- **Key Peaks**:
- ~Time Step 50: Error ~4
- ~Time Step 150: Error ~7
- ~Time Step 250: Error ~6
- ~Time Step 400: Error ~10 (highest spike)
- **General Behavior**: Error oscillates between ~0.5 and ~10, with sharp increases and decreases.
2. **MISRP (Red Solid Line)**:
- **Trend**: Smoother, with smaller and less frequent spikes.
- **Key Peaks**:
- ~Time Step 50: Error ~1.5
- ~Time Step 200: Error ~1.2
- ~Time Step 350: Error ~1.8
- **General Behavior**: Error remains below 2 for most of the time steps, with minor fluctuations.
### Key Observations
- **SR with Bayesian** shows significantly higher error variability, with spikes exceeding 7 and reaching 10 at the final time step.
- **MISRP** maintains lower and more stable error values, with peaks rarely exceeding 2.
- The largest discrepancy occurs at Time Step 400, where SR with Bayesian spikes to 10 while MISRP remains near 1.8.
### Interpretation
The data suggests that the **SR with Bayesian** method is more sensitive to temporal variations, leading to higher and more erratic errors. This could indicate overfitting, sensitivity to noise, or reliance on probabilistic assumptions that amplify uncertainty over time. In contrast, **MISRP** demonstrates greater stability, implying a more robust or regularized approach that mitigates error fluctuations. The spike at Time Step 400 for SR with Bayesian warrants further investigation—it may reflect a specific event, data anomaly, or model limitation. The consistent performance of MISRP highlights its potential advantage in scenarios requiring reliable, low-error predictions.