## Density Plot: Law School Admissions
### Overview
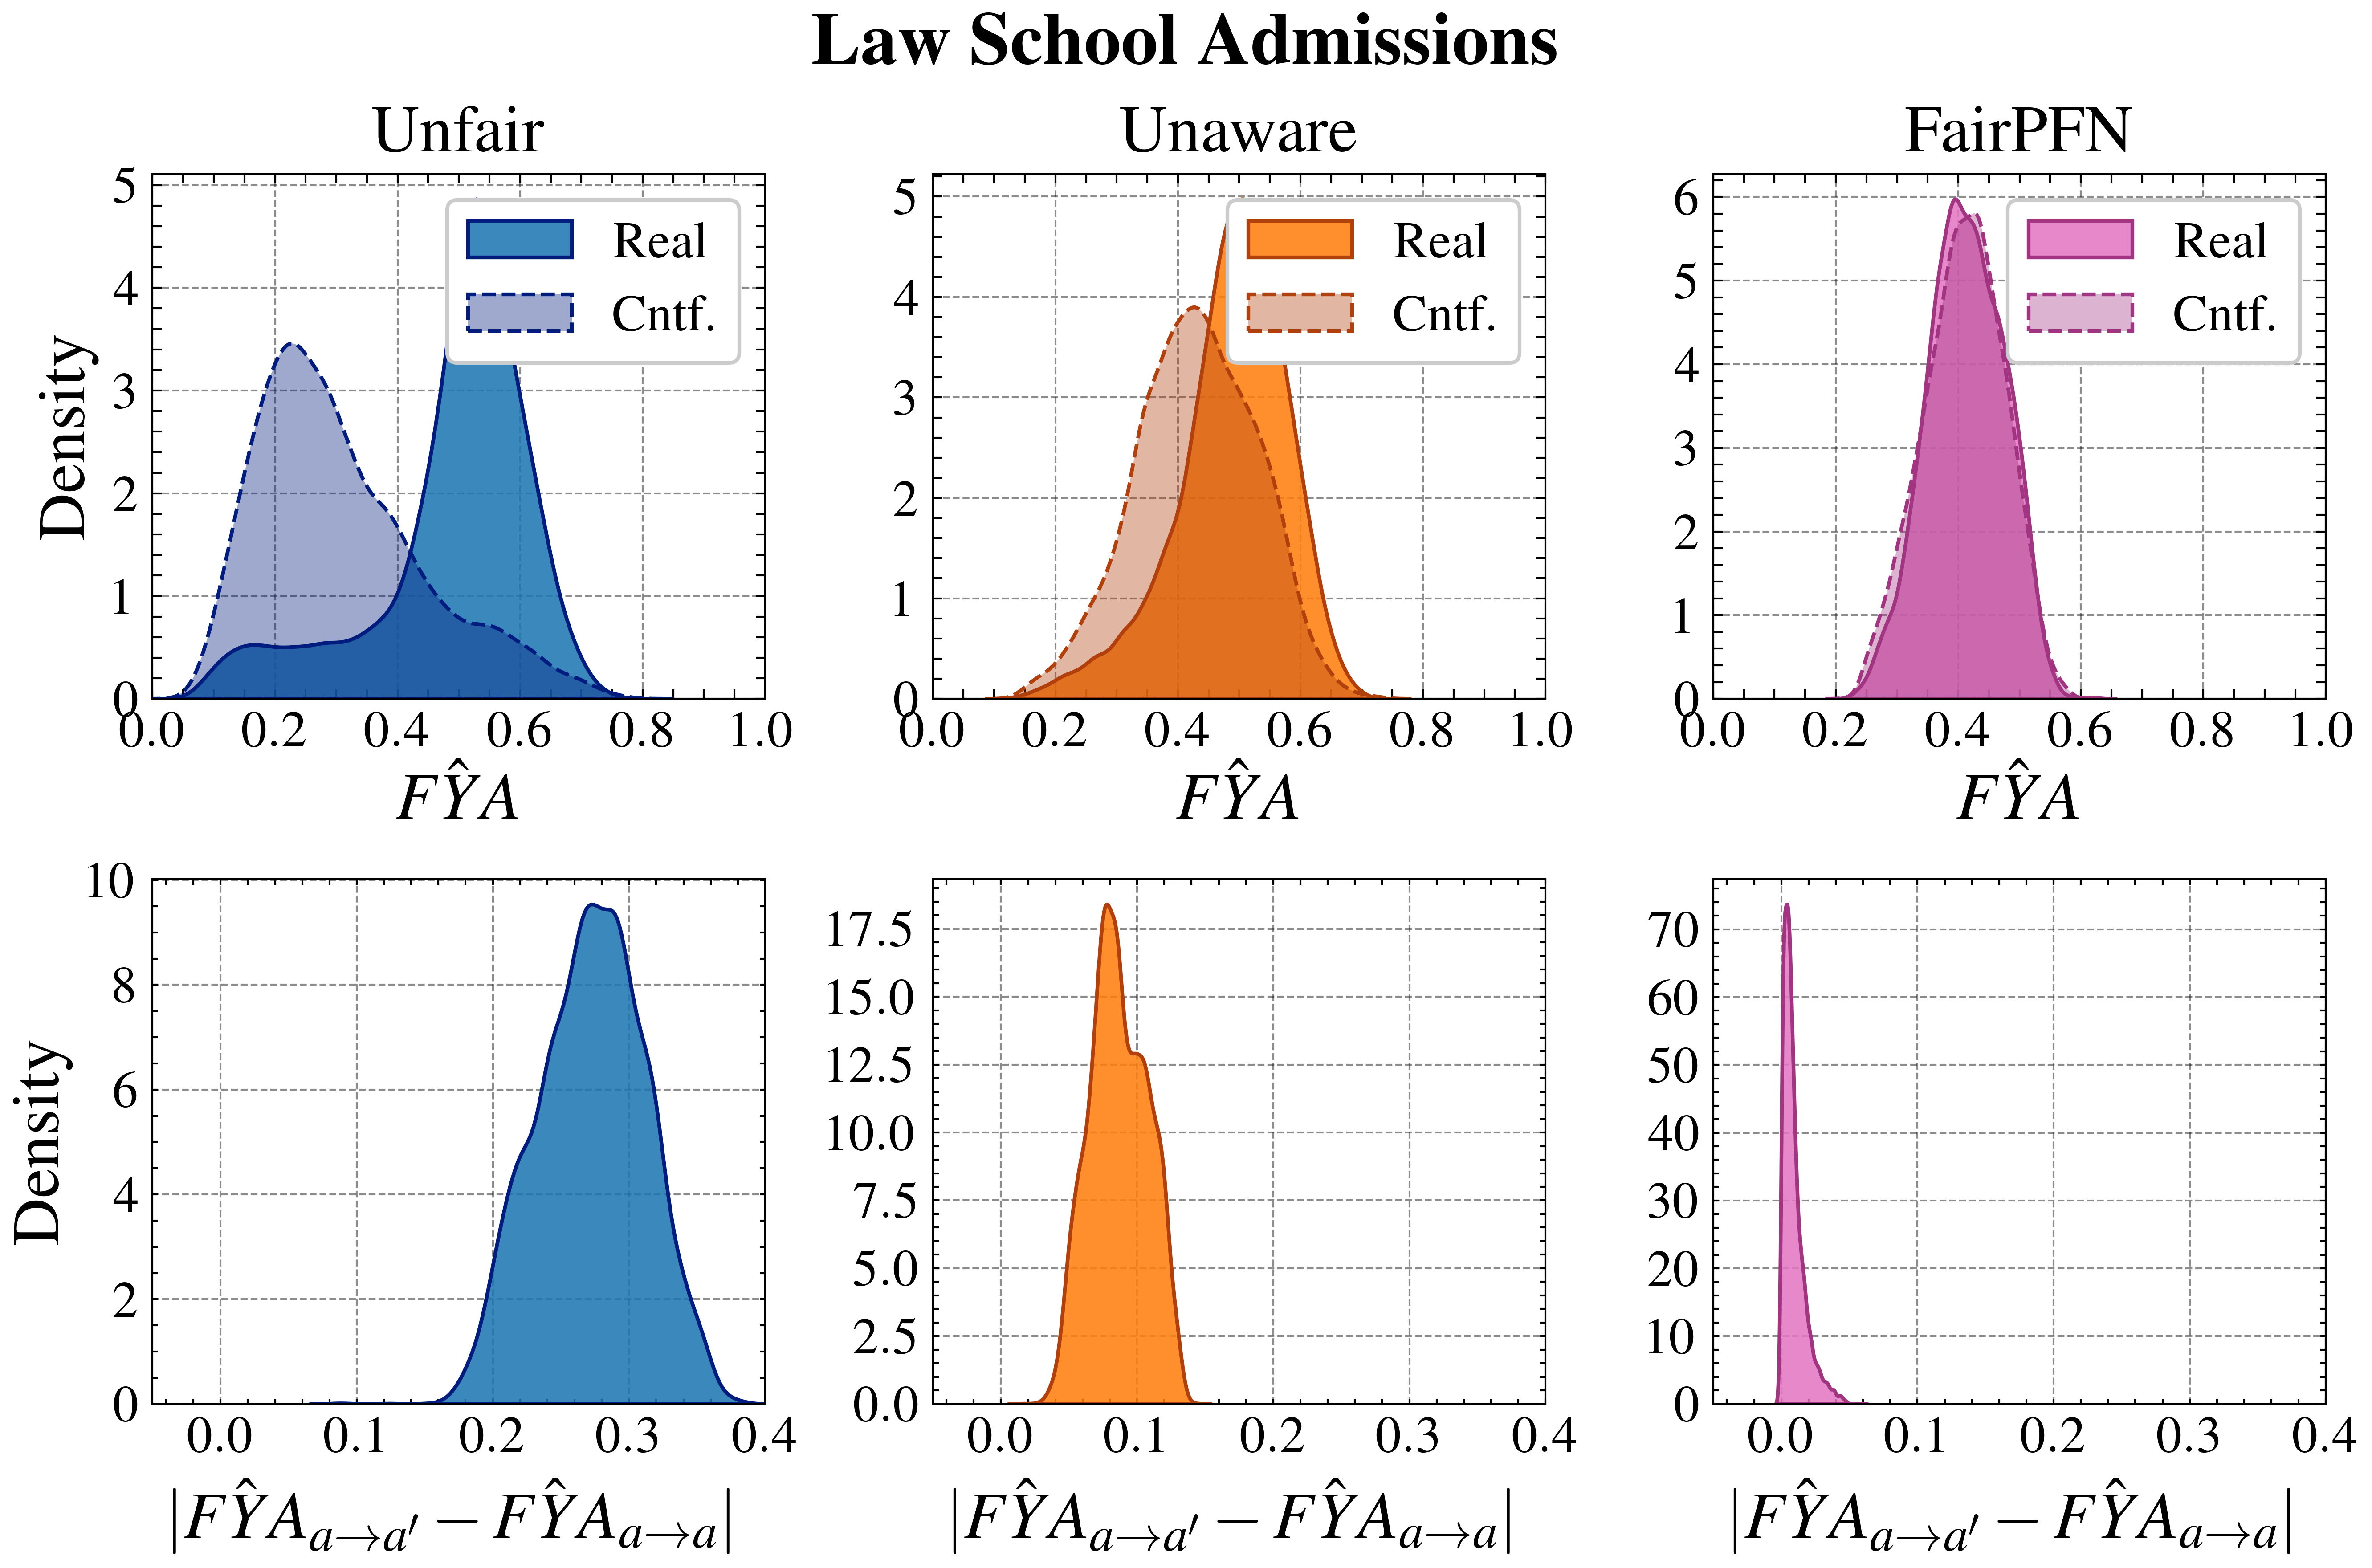
The image presents six density plots arranged in a 2x3 grid, visualizing the distribution of two variables related to law school admissions under three different scenarios: "Unfair," "Unaware," and "FairPFN." Each scenario has two plots: the top plot shows the distribution of FYA, and the bottom plot shows the distribution of the absolute difference between FYA(a->a') and FYA(a->a). The plots compare "Real" data against "Cntf." (counterfactual) data.
### Components/Axes
**Overall Title:** Law School Admissions
**Top Row Plots:**
* **X-axis (all three):** FŶA, ranging from 0.0 to 1.0, with tick marks at intervals of 0.2.
* **Y-axis (all three):** Density, ranging from 0 to 5 (Unfair, Unaware) and 0 to 6 (FairPFN), with tick marks at intervals of 1.
* **Titles (left to right):** Unfair, Unaware, FairPFN
* **Legend (top-right of each plot):**
* "Real": Solid filled area. Blue for "Unfair", Orange for "Unaware", and Pink for "FairPFN".
* "Cntf.": Dashed line. Light blue for "Unfair", Light orange for "Unaware", and Light pink for "FairPFN".
**Bottom Row Plots:**
* **X-axis (all three):** |FŶA<sub>a→a'</sub> - FŶA<sub>a→a</sub>|, ranging from 0.0 to 0.4, with tick marks at intervals of 0.1.
* **Y-axis (all three):** Density, ranging from 0 to 10 (Unfair), 0 to 17.5 (Unaware), and 0 to 70 (FairPFN), with tick marks at varying intervals.
* **Titles (left to right):** |FŶA<sub>a→a'</sub> - FŶA<sub>a→a</sub>| for all three.
* **Color:**
* "Unfair": Blue
* "Unaware": Orange
* "FairPFN": Pink
### Detailed Analysis
**Top Row - Unfair:**
* **Real (Blue):** The "Real" distribution is unimodal, peaking around FŶA = 0.6, with a range from approximately 0.2 to 0.8.
* **Cntf. (Light Blue Dashed):** The "Cntf." distribution is also unimodal, peaking around FŶA = 0.3, with a range from approximately 0.0 to 0.6.
**Top Row - Unaware:**
* **Real (Orange):** The "Real" distribution is unimodal, peaking around FŶA = 0.5, with a range from approximately 0.2 to 0.8.
* **Cntf. (Light Orange Dashed):** The "Cntf." distribution is unimodal, peaking around FŶA = 0.4, with a range from approximately 0.1 to 0.7.
**Top Row - FairPFN:**
* **Real (Pink):** The "Real" distribution is unimodal, peaking around FŶA = 0.4, with a range from approximately 0.2 to 0.6.
* **Cntf. (Light Pink Dashed):** The "Cntf." distribution is unimodal, peaking around FŶA = 0.4, with a range from approximately 0.2 to 0.6. The "Real" and "Cntf." distributions are very similar.
**Bottom Row - Unfair:**
* **Blue:** The distribution is unimodal, peaking around |FŶA<sub>a→a'</sub> - FŶA<sub>a→a</sub>| = 0.3, with a range from approximately 0.1 to 0.4.
**Bottom Row - Unaware:**
* **Orange:** The distribution is unimodal, peaking sharply around |FŶA<sub>a→a'</sub> - FŶA<sub>a→a</sub>| = 0.1, with a range from approximately 0.0 to 0.2.
**Bottom Row - FairPFN:**
* **Pink:** The distribution is highly concentrated and unimodal, peaking sharply around |FŶA<sub>a→a'</sub> - FŶA<sub>a→a</sub>| = 0.0, with a very narrow range close to 0.
### Key Observations
* In the "Unfair" scenario, the "Real" and "Cntf." distributions of FŶA are noticeably different, suggesting a significant impact of unfairness on the outcome.
* In the "Unaware" scenario, the "Real" and "Cntf." distributions of FŶA are somewhat similar, but the peak of the "Real" distribution is slightly shifted to the right compared to the "Cntf." distribution.
* In the "FairPFN" scenario, the "Real" and "Cntf." distributions of FŶA are almost identical, indicating that the FairPFN model effectively mitigates unfairness.
* The distributions of |FŶA<sub>a→a'</sub> - FŶA<sub>a→a</sub>| show that the "FairPFN" scenario results in the smallest difference between FŶA<sub>a→a'</sub> and FŶA<sub>a→a</sub>, suggesting that it promotes fairness.
### Interpretation
The density plots illustrate the impact of different fairness interventions on the distribution of FŶA and the absolute difference between FŶA<sub>a→a'</sub> and FŶA<sub>a→a</sub>. The "Unfair" scenario serves as a baseline, showing a clear difference between the "Real" and "Cntf." distributions. The "Unaware" scenario shows a slight improvement in fairness, while the "FairPFN" scenario demonstrates the most significant reduction in unfairness, as evidenced by the near-identical "Real" and "Cntf." distributions and the highly concentrated distribution of |FŶA<sub>a→a'</sub> - FŶA<sub>a→a</sub>| around 0. This suggests that the FairPFN model is effective in mitigating unfairness in law school admissions.