## Density Plots: Law School Admissions Fairness Analysis
### Overview
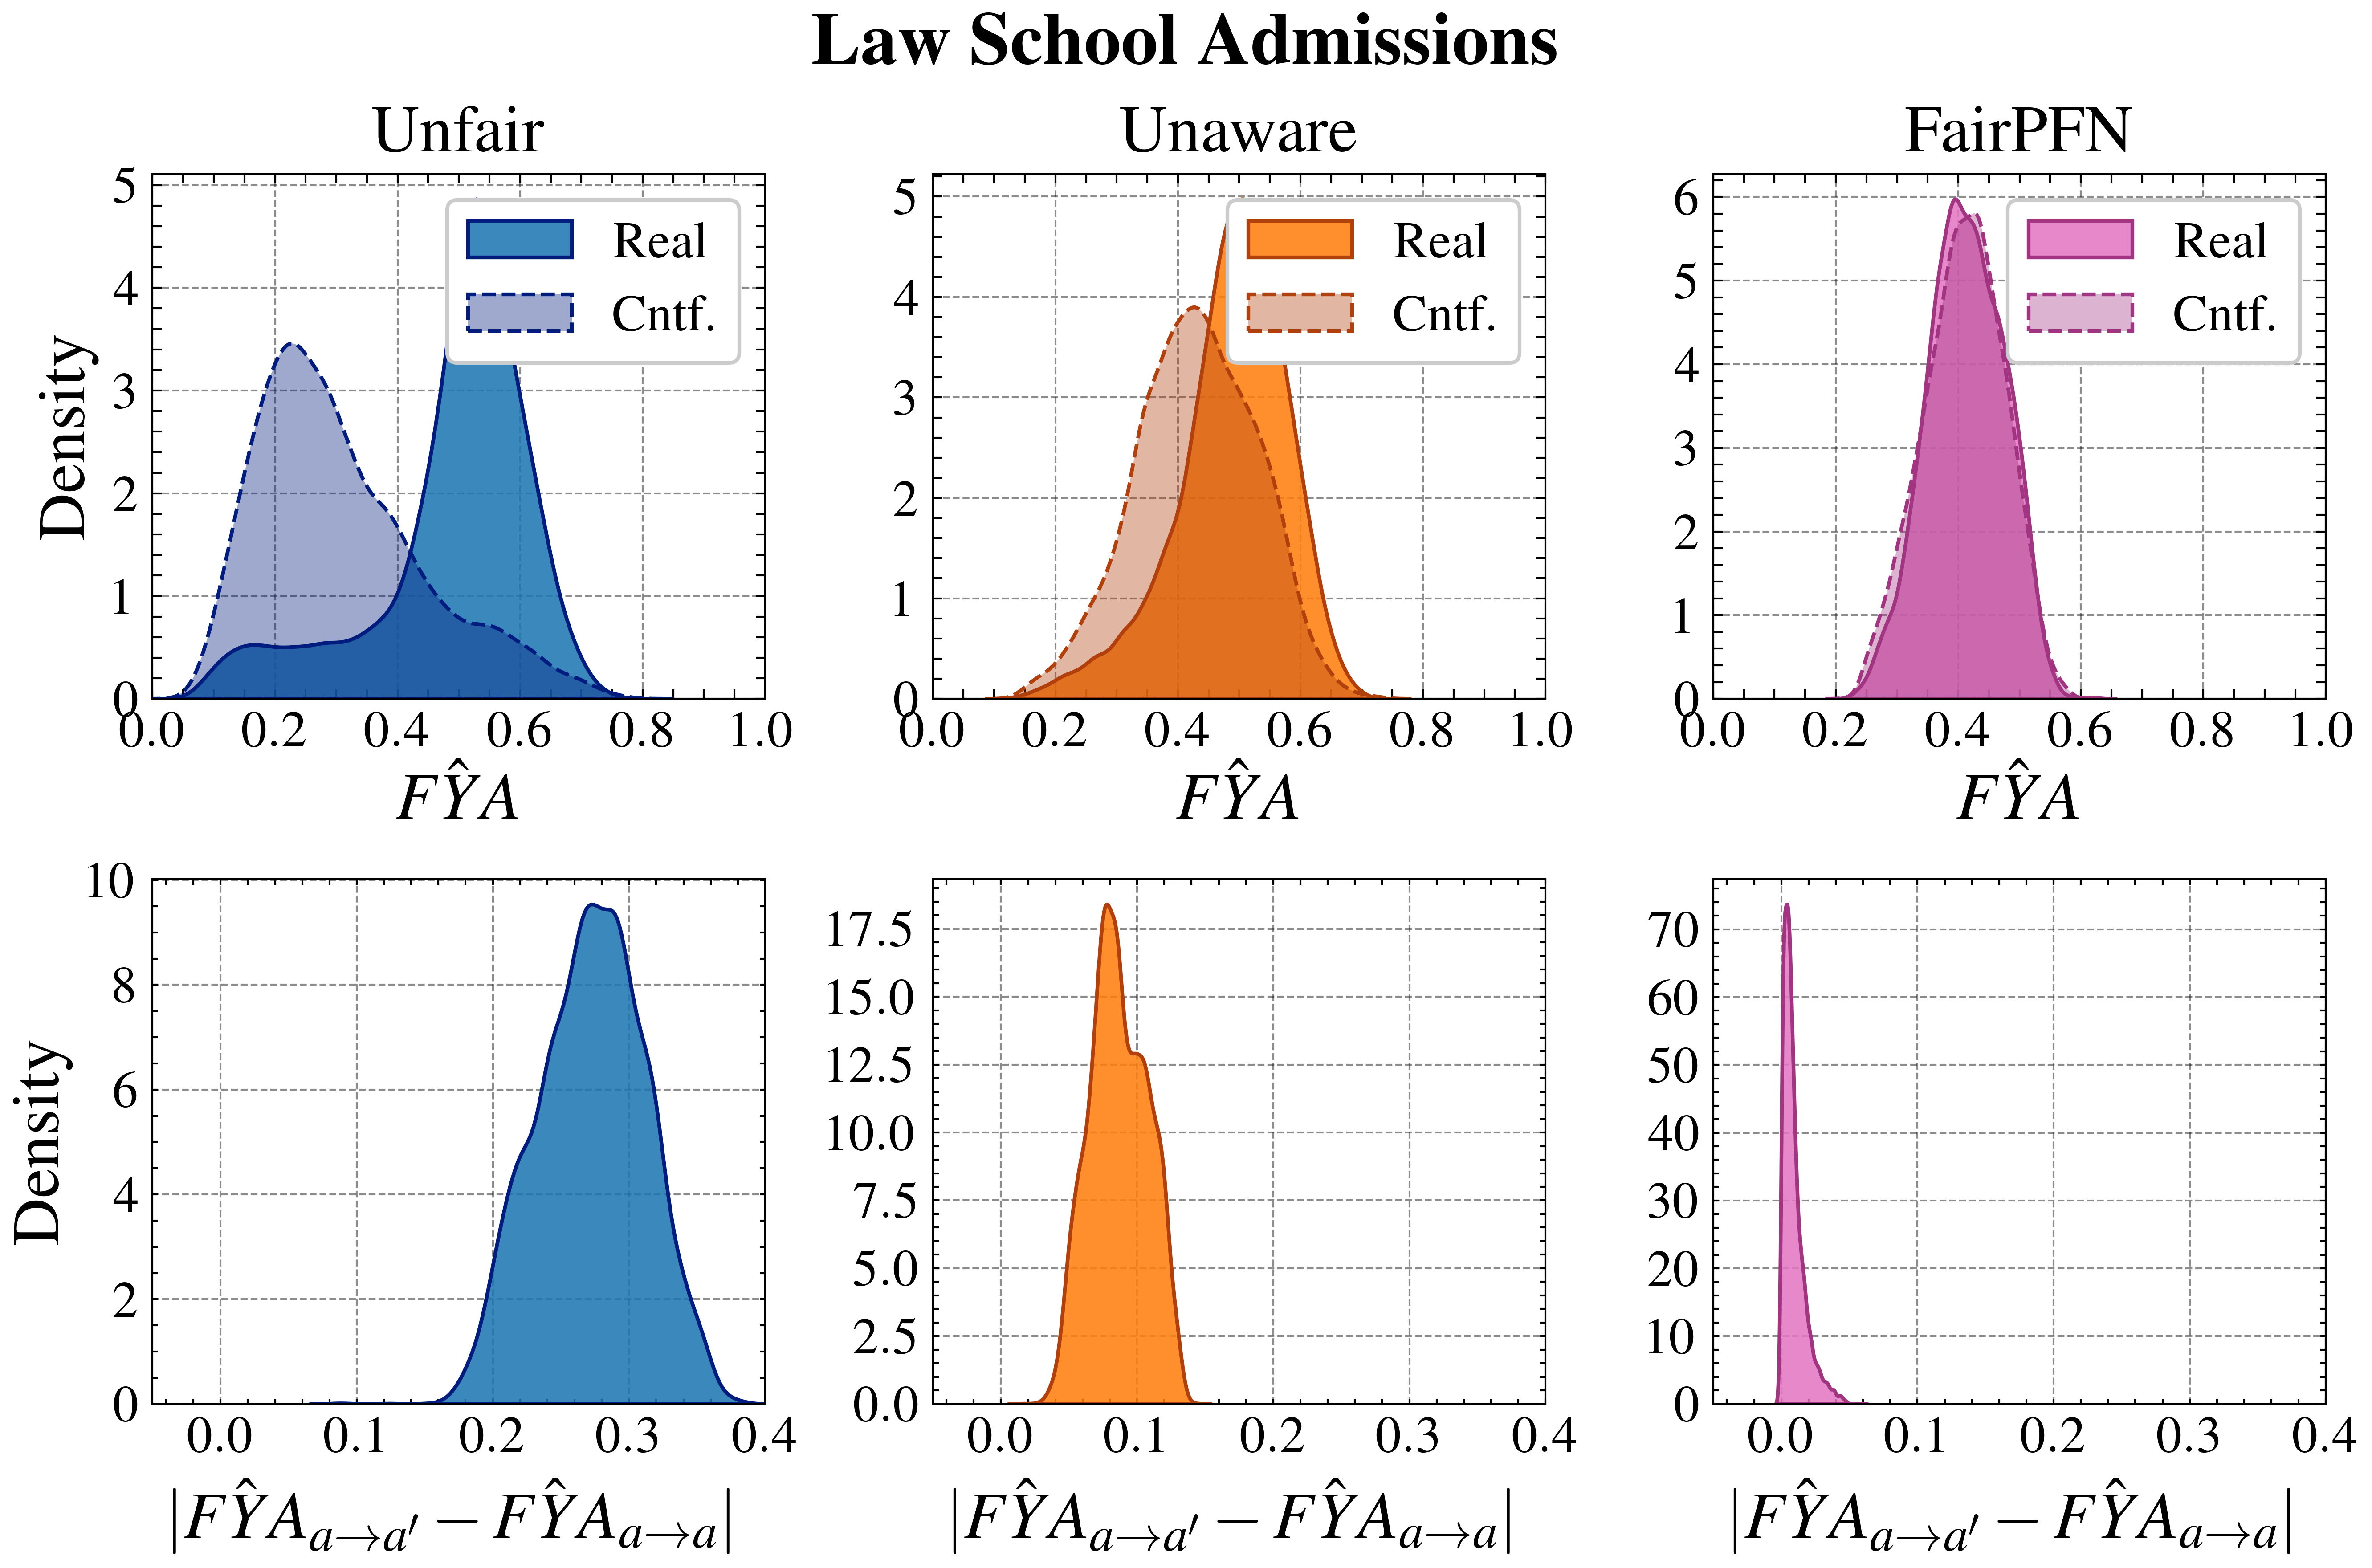
The image displays a 2x3 grid of density plots titled "Law School Admissions." It compares the distribution of a fairness-related metric, denoted as **FŶA**, across three different modeling approaches ("Unfair," "Unaware," "FairPFN") under two conditions ("Real" and "Cntf."). The bottom row analyzes the absolute change in this metric when an attribute is altered.
### Components/Axes
* **Overall Title:** "Law School Admissions" (centered at the top).
* **Column Headers (Top Row):** "Unfair" (left), "Unaware" (center), "FairPFN" (right).
* **Top Row Plots:**
* **X-axis:** Labeled **FŶA**. Scale ranges from 0.0 to 1.0 with major ticks at 0.0, 0.2, 0.4, 0.6, 0.8, 1.0.
* **Y-axis:** Labeled **Density**. Scale varies per plot (0-5 for Unfair/Unaware, 0-6 for FairPFN).
* **Legend (in each top plot, top-right corner):**
* **Real:** Solid fill color (blue for Unfair, orange for Unaware, magenta for FairPFN).
* **Cntf.:** Dashed outline with a lighter, semi-transparent fill of the same hue.
* **Bottom Row Plots:**
* **X-axis:** Labeled **|FŶA_{a→a'} - FŶA_{a→a}|**. Scale ranges from 0.0 to 0.4 with major ticks at 0.0, 0.1, 0.2, 0.3, 0.4.
* **Y-axis:** Labeled **Density**. Scale varies significantly per plot (0-10 for Unfair, 0-17.5 for Unaware, 0-70 for FairPFN).
* **No legends** are present in the bottom row plots. The color corresponds to the column (blue, orange, magenta).
### Detailed Analysis
**Top Row: Distribution of FŶA**
* **Unfair (Blue):** The "Real" distribution is bimodal, with a smaller peak near 0.2 and a dominant peak around 0.55. The "Cntf." distribution is unimodal, peaking sharply around 0.25. There is a significant separation between the two distributions.
* **Unaware (Orange):** The "Real" and "Cntf." distributions overlap considerably. Both are unimodal, with the "Real" peak slightly to the right (around 0.48) of the "Cntf." peak (around 0.42).
* **FairPFN (Magenta):** The "Real" and "Cntf." distributions are nearly identical, showing almost complete overlap. Both form a single, sharp peak centered at approximately 0.4.
**Bottom Row: Distribution of |FŶA_{a→a'} - FŶA_{a→a}|**
* **Unfair (Blue):** The distribution of the absolute difference is unimodal and symmetric, peaking at approximately 0.28. The density at the peak is ~9.5.
* **Unaware (Orange):** The distribution is unimodal and slightly right-skewed, peaking at approximately 0.08. The density at the peak is ~18.
* **FairPFN (Magenta):** The distribution is extremely narrow and tall, peaking very close to 0.0 (approximately 0.01). The density at the peak is exceptionally high, reaching ~72.
### Key Observations
1. **Progression of Overlap:** Moving from left to right (Unfair → Unaware → FairPFN), the "Real" and "Cntf." distributions in the top row show increasing overlap, culminating in near-perfect alignment for FairPFN.
2. **Shift in Central Tendency:** The central peak of the "Real" distribution shifts leftward across the columns: from ~0.55 (Unfair) to ~0.48 (Unaware) to ~0.4 (FairPFN).
3. **Magnitude of Change:** The bottom row reveals a dramatic reduction in the magnitude of the metric's change (|FŶA_{a→a'} - FŶA_{a→a}|) across the models. The peak of the distribution moves from ~0.28 (Unfair) to ~0.08 (Unaware) to ~0.01 (FairPFN).
4. **Precision of FairPFN:** The FairPFN model not only aligns the real and counterfactual distributions but also results in an extremely stable metric (very low absolute change), as indicated by the very high, narrow density peak near zero in the bottom-right plot.
### Interpretation
This visualization demonstrates the effectiveness of different algorithmic approaches to fairness in a law school admissions context. **FŶA** likely represents a fairness metric (e.g., related to acceptance rates or outcomes across groups).
* The **"Unfair"** model shows a large discrepancy between real-world outcomes ("Real") and a counterfactual scenario ("Cntf."), suggesting the model's decisions are highly sensitive to the attribute being altered (e.g., race, gender). The large absolute differences in the bottom plot confirm this high sensitivity.
* The **"Unaware"** model, which likely excludes the sensitive attribute from the decision process, reduces but does not eliminate the discrepancy. Some disparity persists, and the model remains moderately sensitive to attribute changes.
* The **"FairPFN"** model achieves two key fairness properties:
1. **Counterfactual Fairness:** The near-perfect overlap of "Real" and "Cntf." distributions indicates that, in a counterfactual world where the sensitive attribute is changed, the model's outcomes would be statistically identical. This is a strong fairness guarantee.
2. **Stability/Robustness:** The extremely low absolute difference values (bottom-right plot) show that the model's fairness metric is highly stable and minimally affected by perturbations to the sensitive attribute.
In summary, the figure argues that the FairPFN method successfully aligns real and counterfactual outcomes and produces a robustly fair model, outperforming both a standard ("Unfair") and an attribute-ignorant ("Unaware") approach.