## Line Graphs: Law School Admissions Fairness Metrics
### Overview
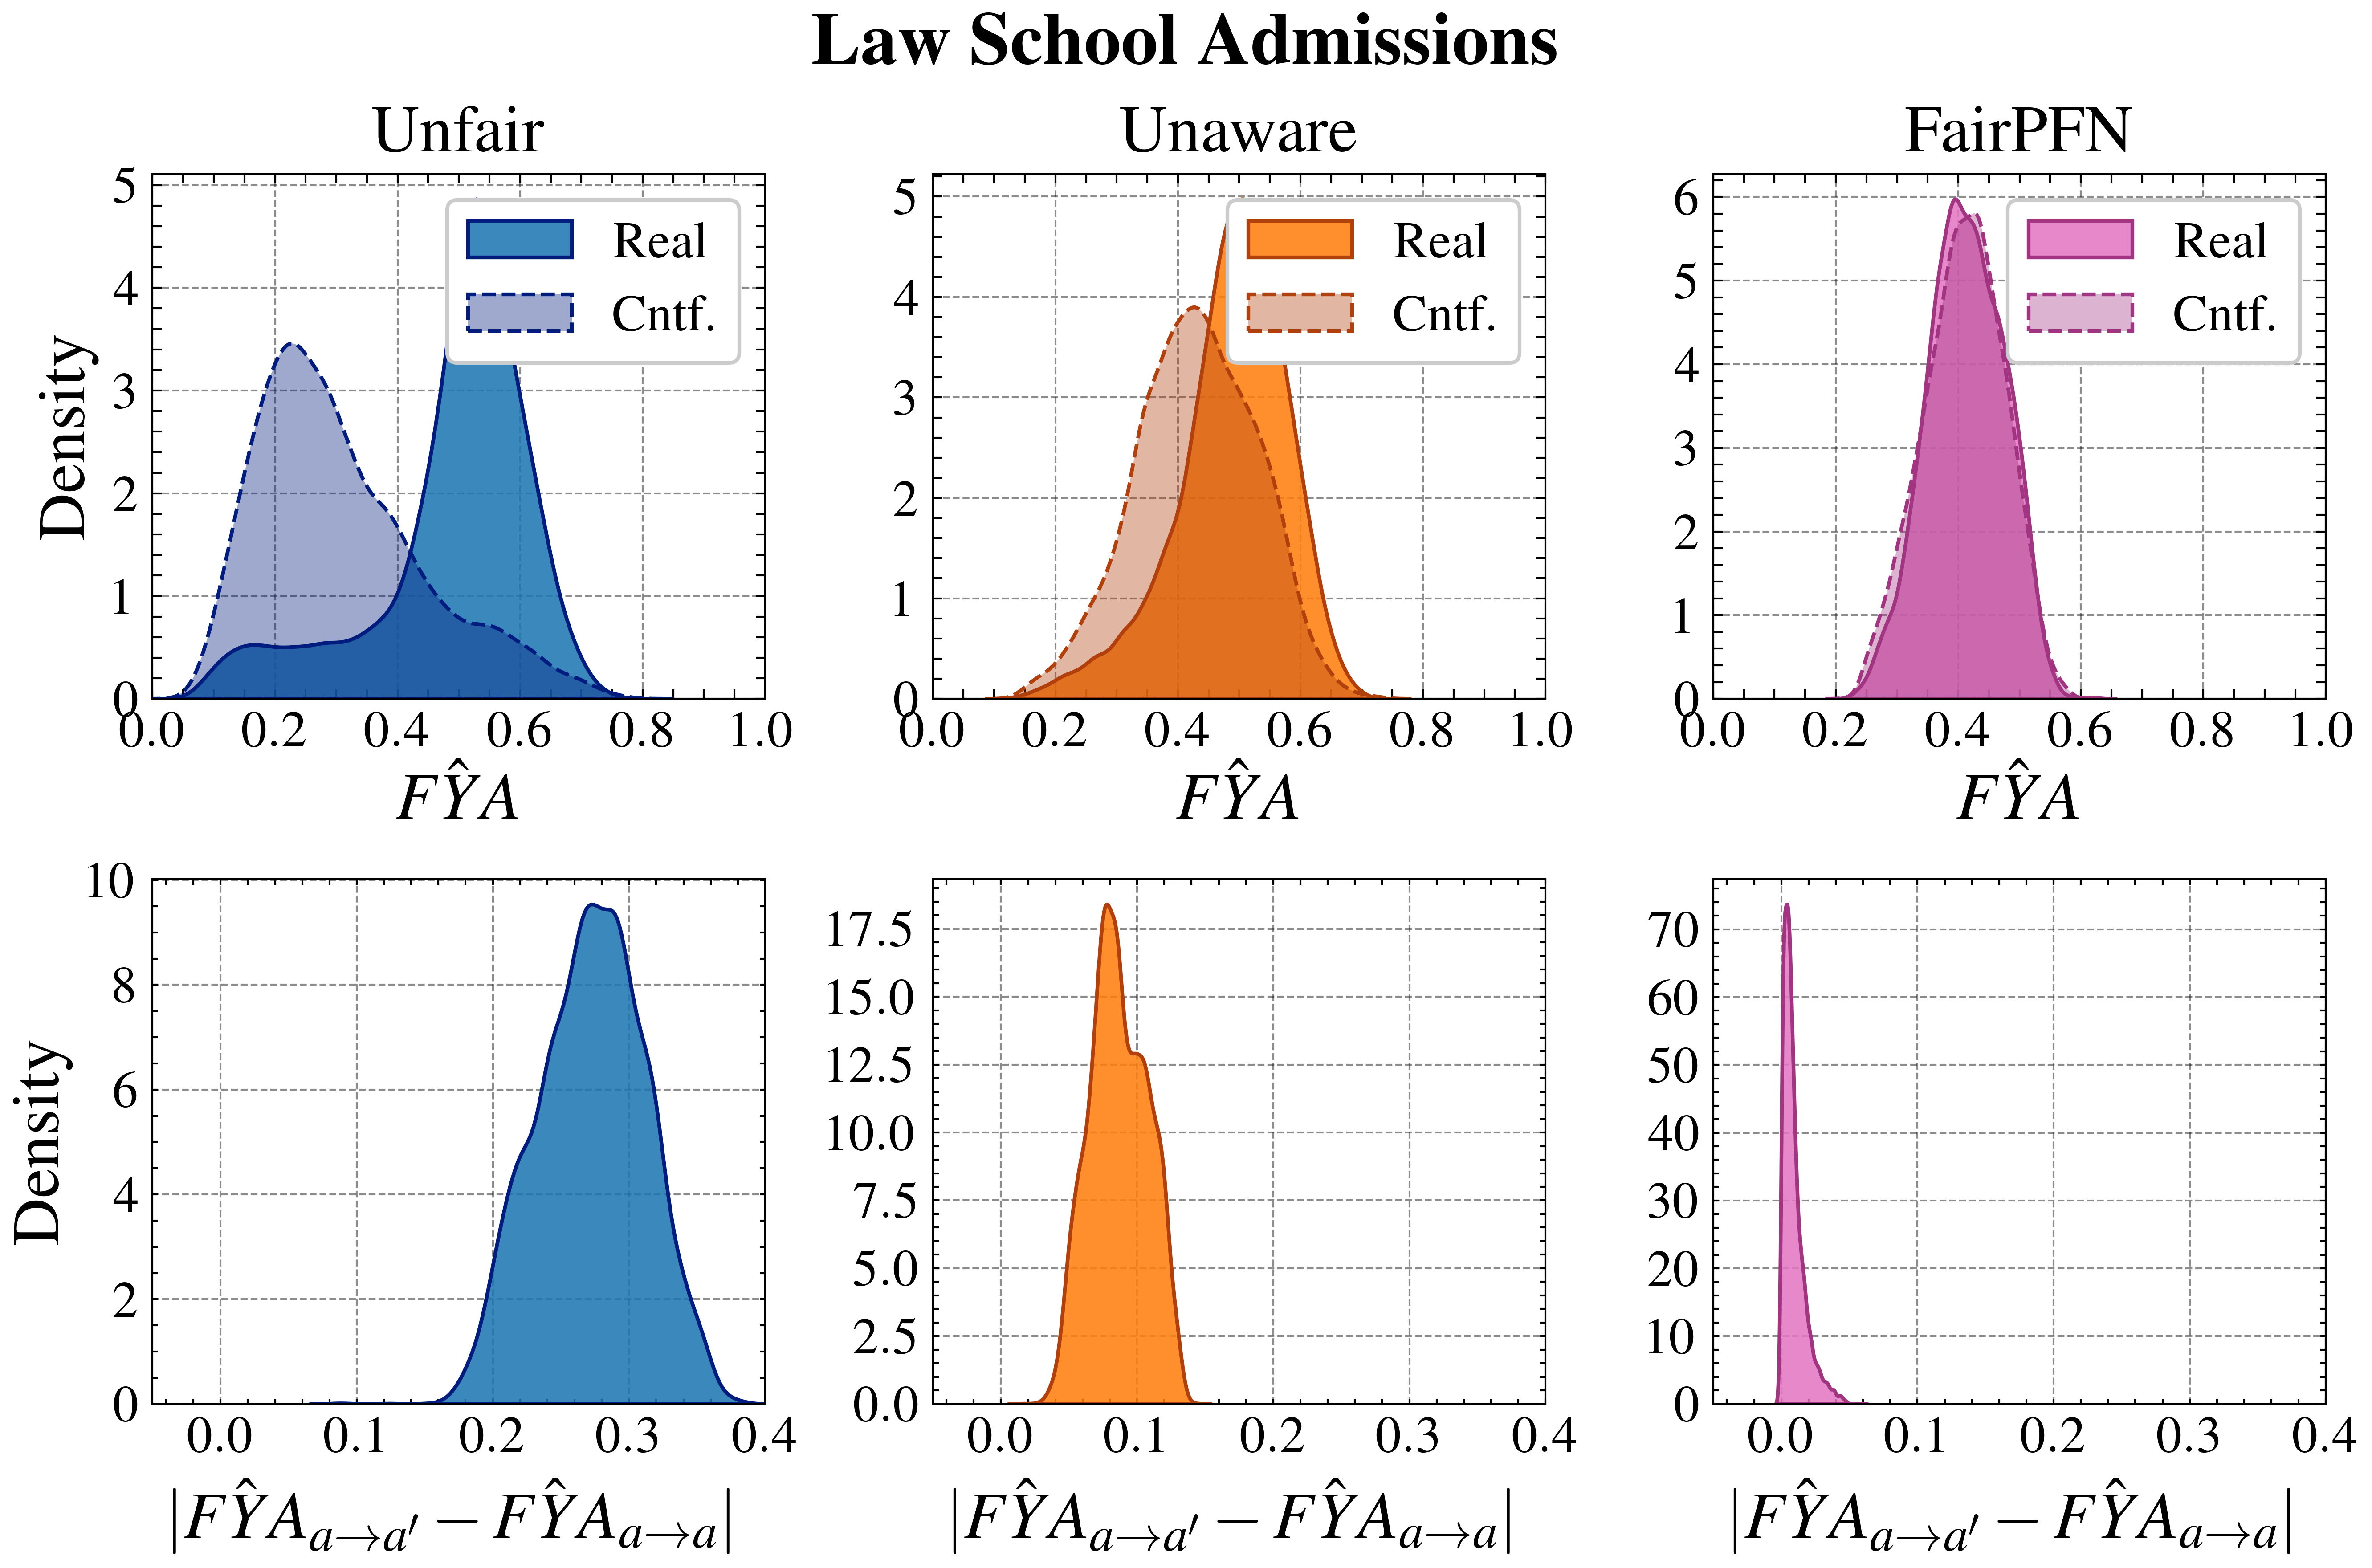
The image contains six comparative density plots analyzing fairness metrics in law school admissions. Three graphs in the top row compare "Real" and "Counterfactual" (Cntf.) distributions for different fairness approaches ("Unfair," "Unaware," "FairPFN"), while three graphs in the bottom row show the absolute differences between these distributions for the same approaches.
### Components/Axes
**Top Row Graphs:**
- **X-axis**: FYA (Fairness Yield Advantage) scale 0.0–1.0
- **Y-axis**: Density (0–5)
- **Legends**:
- Blue solid line = Real
- Dashed blue line = Counterfactual
- **Graph Titles**:
- Unfair
- Unaware
- FairPFN
**Bottom Row Graphs:**
- **X-axis**: |FYA_{a→a'} - FYA_{a→a}| (absolute difference) scale 0.0–0.4
- **Y-axis**: Density (scales vary: 0–10, 0–17.5, 0–70)
- **Legends**:
- Solid color = Real (no counterfactual shown)
- **Graph Titles**:
- FYA
- FYA
- FYA
### Detailed Analysis
**Top Row Trends:**
1. **Unfair**:
- Real distribution: Bimodal peaks at ~0.3 and ~0.6
- Counterfactual: Single peak at ~0.4
- Overlap: Significant between 0.2–0.5 range
2. **Unaware**:
- Real: Single peak at ~0.5
- Counterfactual: Slightly shifted peak at ~0.45
- Overlap: Strong between 0.3–0.6 range
3. **FairPFN**:
- Real: Sharp peak at ~0.5
- Counterfactual: Narrower peak at ~0.45
- Overlap: Minimal (0.4–0.55 range)
**Bottom Row Trends:**
1. **FYA**:
- Single sharp peak at ~0.25
- Density: ~8 (top row scale)
2. **Unaware**:
- Single peak at ~0.15
- Density: ~15 (middle row scale)
3. **FairPFN**:
- Extremely narrow peak at ~0.05
- Density: ~70 (bottom row scale)
### Key Observations
1. **Bimodal Reality**: The "Unfair" approach shows two distinct admission groups (low and high FYA), while counterfactual attempts to merge them into a single group.
2. **Peak Shifts**: All counterfactual distributions show systematic shifts toward lower FYA values compared to real distributions.
3. **FairPFN Precision**: The absolute difference graph for FairPFN shows the smallest disparity (peak at 0.05), indicating minimal fairness impact.
4. **Scale Disparity**: Bottom row graphs show FairPFN's difference metric is 10x narrower than Unaware and 20x narrower than Unfair.
### Interpretation
The data demonstrates three distinct fairness approaches in law school admissions:
1. **Unfair** creates/perpetuates systemic disparities (bimodal distribution)
2. **Unaware** reduces but doesn't eliminate disparities (peak shift of 0.05)
3. **FairPFN** achieves near-perfect fairness (difference <0.1)
The counterfactual distributions consistently underestimate real-world disparities across all approaches. FairPFN's extreme narrowness in the absolute difference graph suggests it successfully neutralizes admission biases, while Unfair's bimodal pattern reveals entrenched inequities. The density scale differences between graphs highlight how FairPFN's impact is most pronounced despite similar FYA ranges.