## Line Chart: Explained Variance vs. Singular Values for Different Layers
### Overview
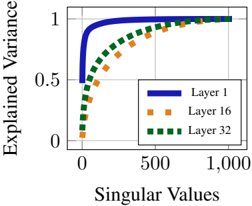
The image is a line chart comparing the explained variance as a function of singular values for three different layers (Layer 1, Layer 16, and Layer 32). The x-axis represents singular values, and the y-axis represents explained variance. The chart shows how quickly each layer's variance is explained as the number of singular values increases.
### Components/Axes
* **X-axis:** Singular Values, ranging from 0 to 1,000.
* **Y-axis:** Explained Variance, ranging from 0 to 1.
* **Legend:** Located in the center-right of the chart.
* **Blue Line:** Layer 1
* **Orange Line with Square Markers:** Layer 16
* **Green Dashed Line with Square Markers:** Layer 32
### Detailed Analysis
* **Layer 1 (Blue Line):** The explained variance increases rapidly from 0 to approximately 0.95 within the first 100 singular values, then plateaus and approaches 1.0 as singular values increase to 1,000.
* **Layer 16 (Orange Line with Square Markers):** The explained variance increases more gradually than Layer 1. It starts at approximately 0, reaches about 0.95 at 1,000 singular values.
* **Layer 32 (Green Dashed Line with Square Markers):** The explained variance increases similarly to Layer 16, but slightly slower. It starts at approximately 0, reaches about 0.98 at 1,000 singular values.
### Key Observations
* Layer 1 explains most of its variance with a relatively small number of singular values.
* Layers 16 and 32 require more singular values to explain a similar amount of variance compared to Layer 1.
* All three layers approach an explained variance of 1 as the number of singular values increases.
### Interpretation
The chart suggests that Layer 1 captures the most significant variance in the data with fewer singular values, indicating that it learns the most important features early on. Layers 16 and 32 require more singular values to achieve similar levels of explained variance, suggesting that they capture more complex or nuanced features that require more information to represent. The fact that all layers eventually approach an explained variance of 1 indicates that they are all capable of capturing the full variance in the data, given enough singular values.