\n
## Line Chart: Explained Variance vs. Singular Values for Different Network Layers
### Overview
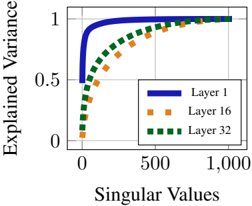
The image is a line chart plotting "Explained Variance" against "Singular Values" for three different layers of a neural network (Layer 1, Layer 16, and Layer 32). The chart illustrates how the cumulative explained variance increases with the number of singular values considered, with each layer exhibiting a distinct curve.
### Components/Axes
* **Chart Type:** Line chart with three data series.
* **X-Axis:**
* **Label:** "Singular Values"
* **Scale:** Linear scale from 0 to 1,000.
* **Major Tick Marks:** 0, 500, 1,000.
* **Y-Axis:**
* **Label:** "Explained Variance"
* **Scale:** Linear scale from 0 to 1.
* **Major Tick Marks:** 0, 0.5, 1.
* **Legend:**
* **Position:** Bottom-right corner of the chart area.
* **Entries:**
1. **Layer 1:** Represented by a solid blue line.
2. **Layer 16:** Represented by a dashed orange line.
3. **Layer 32:** Represented by a dotted green line.
### Detailed Analysis
The chart shows the relationship between the number of singular values used and the proportion of variance they explain for three different layers.
* **Layer 1 (Solid Blue Line):**
* **Trend:** Exhibits the steepest initial ascent. The curve rises almost vertically from (0,0) and begins to plateau very early.
* **Key Data Points (Approximate):**
* At ~50 singular values, explained variance is already > 0.9.
* At ~100 singular values, explained variance is very close to 1.0.
* The line remains flat at ~1.0 for the remainder of the x-axis (up to 1,000).
* **Layer 16 (Dashed Orange Line):**
* **Trend:** Shows a more gradual, concave-down increase compared to Layer 1.
* **Key Data Points (Approximate):**
* At 0 singular values, explained variance is 0.
* At ~250 singular values, explained variance is ~0.7.
* At ~500 singular values, explained variance is ~0.9.
* Approaches 1.0 asymptotically, reaching near 1.0 around 800-1,000 singular values.
* **Layer 32 (Dotted Green Line):**
* **Trend:** Has the most gradual initial slope of the three lines, rising the slowest.
* **Key Data Points (Approximate):**
* At 0 singular values, explained variance is 0.
* At ~250 singular values, explained variance is ~0.5.
* At ~500 singular values, explained variance is ~0.8.
* At ~750 singular values, explained variance is ~0.95.
* Approaches 1.0, nearly converging with the other lines at 1,000 singular values.
### Key Observations
1. **Hierarchy of Convergence:** There is a clear ordering in how quickly each layer's explained variance saturates. Layer 1 saturates fastest, followed by Layer 16, and then Layer 32.
2. **Common Asymptote:** All three lines converge towards an explained variance of 1.0 as the number of singular values increases towards 1,000.
3. **Shape Consistency:** All curves are monotonically increasing and concave down, which is characteristic of cumulative explained variance plots from Singular Value Decomposition (SVD) or Principal Component Analysis (PCA).
4. **Visual Separation:** The three lines are distinctly separated in the region between 0 and approximately 800 singular values, making their different behaviors easy to compare.
### Interpretation
This chart visualizes the **spectral decay** or **energy compaction** property of the weight matrices (or activation matrices) from different layers of a neural network.
* **What it demonstrates:** The steep curve for **Layer 1** indicates that its information (variance) is concentrated in a very small number of dominant components (singular values). A few principal directions capture almost all the layer's activity. This is typical of early network layers, which often learn simple, oriented edge detectors or color blobs.
* **The progression to Layer 32:** The progressively shallower curves for **Layer 16** and **Layer 32** show that information in deeper layers is more distributed across a larger number of components. No single direction or small set of directions dominates. This aligns with the understanding that deeper layers encode more complex, distributed, and abstract features where information is entangled across many neurons.
* **Why it matters:** This analysis is crucial for understanding model compressibility, the effectiveness of low-rank approximations, and the fundamental nature of representations at different depths. A layer with fast spectral decay (like Layer 1) is more amenable to compression or pruning. The distributed representation in Layer 32 suggests a more robust but less easily compressible code. The convergence of all lines to 1.0 confirms that using all 1,000 singular values (likely the full rank of the matrix) captures all variance, as expected.