## Line Chart: Explained Variance vs Singular Values
### Overview
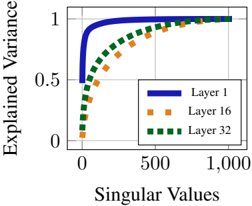
The chart illustrates the relationship between singular values (x-axis) and explained variance (y-axis) for three distinct layers (Layer 1, Layer 16, Layer 32). The y-axis represents the proportion of variance explained, normalized to a maximum of 1.0, while the x-axis quantifies singular values up to 1,000. All three layers exhibit saturation behavior, but with differing rates of convergence.
### Components/Axes
- **X-axis (Singular Values)**: Linear scale from 0 to 1,000, with gridlines at 0, 500, and 1,000.
- **Y-axis (Explained Variance)**: Linear scale from 0 to 1.0, with gridlines at 0, 0.5, and 1.0.
- **Legend**: Positioned in the bottom-right corner, with three entries:
- **Layer 1**: Solid blue line
- **Layer 16**: Orange square markers
- **Layer 32**: Green square markers
### Detailed Analysis
1. **Layer 1 (Blue Line)**:
- Starts at (0, 0.5) and rises sharply to (500, 1.0).
- Remains flat at 1.0 for all singular values ≥ 500.
- Represents the steepest ascent, indicating rapid variance explanation.
2. **Layer 16 (Orange Squares)**:
- Begins at (0, ~0.2) and increases gradually.
- Reaches ~0.8 at x=1,000.
- Shows stepwise increments, suggesting incremental contributions from singular values.
3. **Layer 32 (Green Squares)**:
- Starts at (0, ~0.1) and rises slowly.
- Achieves ~0.6 at x=1,000.
- Exhibits the slowest rate of increase, indicating minimal variance explanation per singular value.
### Key Observations
- **Layer 1 Dominance**: Explains full variance (1.0) using only the first 500 singular values, while Layers 16 and 32 require all 1,000 values to approach saturation.
- **Diminishing Returns**: Layers 16 and 32 show progressively smaller gains per singular value, consistent with hierarchical feature importance.
- **Saturation Thresholds**: Layer 1 saturates at x=500, whereas Layers 16 and 32 require full x-axis range to reach ~80% and ~60% variance, respectively.
### Interpretation
This chart likely represents the cumulative explained variance in a dimensionality reduction or neural network context (e.g., PCA or deep learning layer-wise analysis). Layer 1’s rapid convergence suggests it captures dominant features or patterns, while Layers 16 and 32 encode finer-grained or redundant information. The disparity in convergence rates implies that early layers (Layer 1) are critical for high-level representation, whereas deeper layers (16, 32) contribute less efficiently. This aligns with principles of feature hierarchy in models, where initial layers extract coarse structures and deeper layers refine details. The use of singular values as the x-axis reinforces a connection to linear algebra-based methods like PCA, where singular values quantify the importance of orthogonal components.