## Bar Chart: Qualitative Assessments of Model Baseline Results
### Overview
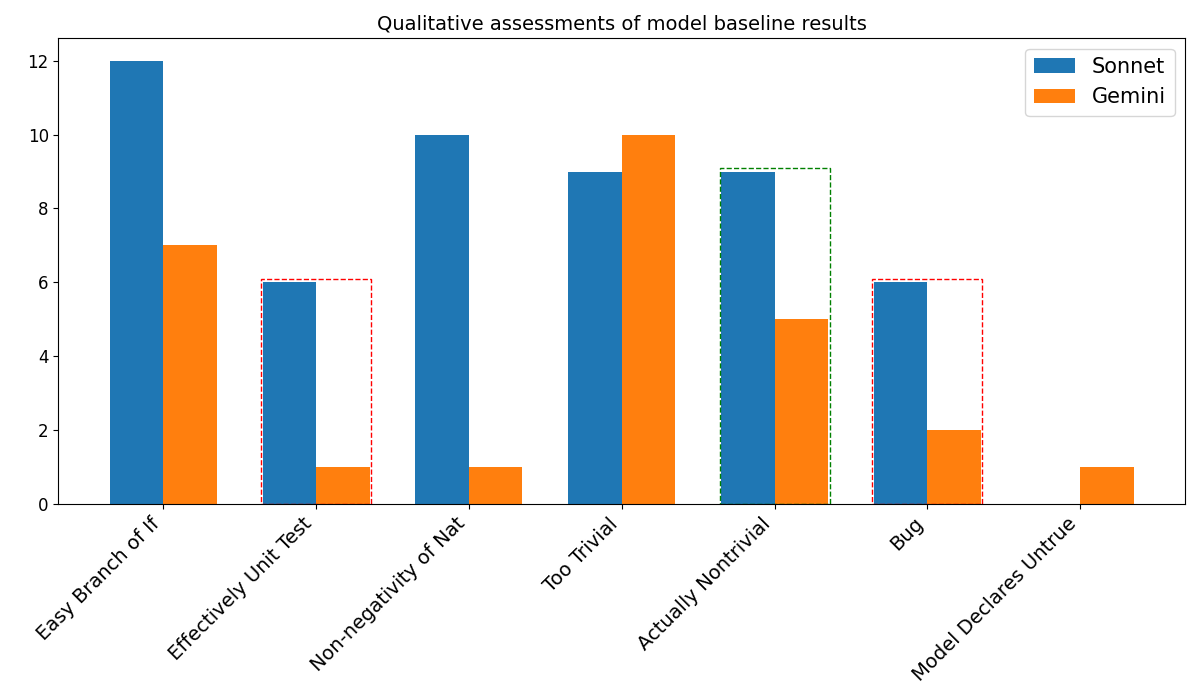
The image is a bar chart comparing the qualitative assessments of two models, "Sonnet" and "Gemini," across several categories. The y-axis represents a count or frequency, while the x-axis lists the categories being assessed.
### Components/Axes
* **Title:** Qualitative assessments of model baseline results
* **X-axis:** Categories: Easy Branch of If, Effectively Unit Test, Non-negativity of Nat, Too Trivial, Actually Nontrivial, Bug, Model Declares Untrue. The labels are rotated diagonally.
* **Y-axis:** Numerical scale ranging from 0 to 12, with increments of 2.
* **Legend:** Located in the top-right corner.
* Blue: Sonnet
* Orange: Gemini
### Detailed Analysis
Here's a breakdown of the data for each category:
* **Easy Branch of If:**
* Sonnet (Blue): Approximately 12
* Gemini (Orange): Approximately 7
* **Effectively Unit Test:**
* Sonnet (Blue): Approximately 6
* Gemini (Orange): Approximately 1
* **Non-negativity of Nat:**
* Sonnet (Blue): Approximately 10
* Gemini (Orange): Approximately 1
* **Too Trivial:**
* Sonnet (Blue): Approximately 9
* Gemini (Orange): Approximately 10
* **Actually Nontrivial:**
* Sonnet (Blue): Approximately 9
* Gemini (Orange): Approximately 5
* **Bug:**
* Sonnet (Blue): Approximately 6
* Gemini (Orange): Approximately 2
* **Model Declares Untrue:**
* Sonnet (Blue): Approximately 0
* Gemini (Orange): Approximately 1
### Key Observations
* Sonnet generally scores higher than Gemini in the first three categories (Easy Branch of If, Effectively Unit Test, Non-negativity of Nat).
* Gemini scores slightly higher than Sonnet in the "Too Trivial" category.
* Both models have relatively low scores in the "Model Declares Untrue" category.
### Interpretation
The bar chart provides a qualitative comparison of the "Sonnet" and "Gemini" models across different assessment categories. The data suggests that "Sonnet" performs better in categories like "Easy Branch of If," "Effectively Unit Test," and "Non-negativity of Nat," while "Gemini" shows a slightly better performance in the "Too Trivial" category. The low scores in "Model Declares Untrue" indicate that both models struggle with this particular aspect. The chart highlights the strengths and weaknesses of each model, allowing for a more nuanced understanding of their performance.