\n
## Line Chart: Training Performance Metrics
### Overview
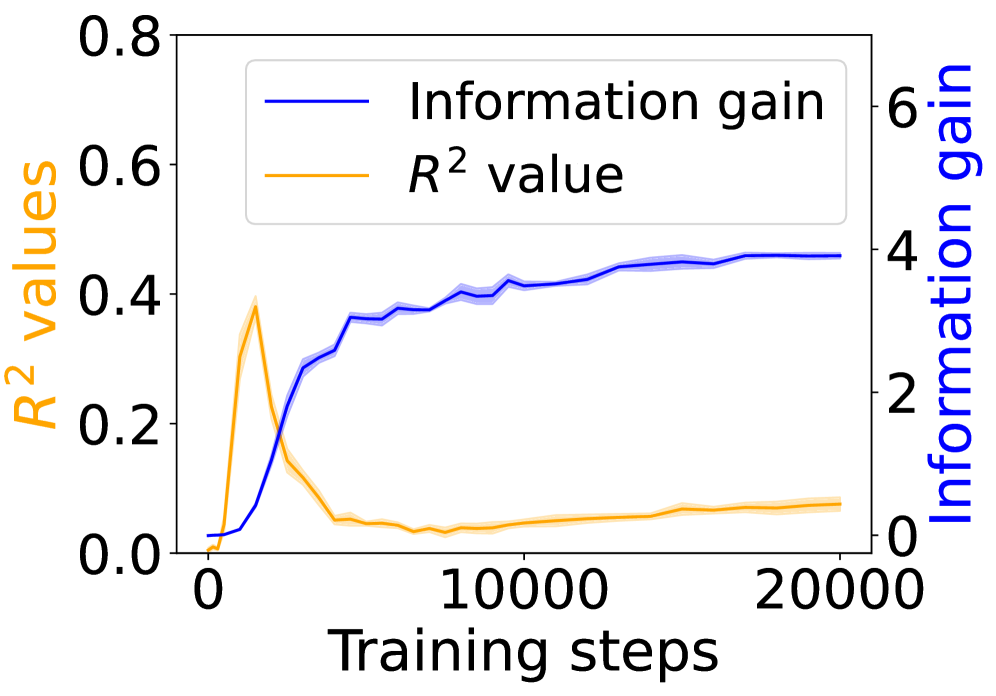
This image presents a line chart illustrating the relationship between training steps and two performance metrics: Information Gain and R² value. The chart tracks these metrics during a training process, likely for a machine learning model. The x-axis represents the number of training steps, while the left y-axis represents the R² value and the right y-axis represents the Information Gain.
### Components/Axes
* **X-axis:** "Training steps" ranging from approximately 0 to 20000.
* **Left Y-axis:** "R² values" ranging from 0.0 to 0.8.
* **Right Y-axis:** "Information gain" ranging from 0 to 6.
* **Legend:** Located in the top-right corner, containing two entries:
* "Information gain" - represented by a dark blue line.
* "R² value" - represented by an orange line.
### Detailed Analysis
The chart displays two distinct lines representing the two metrics.
**Information Gain (Dark Blue Line):**
The line initially rises sharply from approximately 0 at 0 training steps, reaching a value of around 2 at approximately 2000 training steps. It then plateaus with some fluctuations, reaching a maximum value of approximately 4.4 at around 12000 training steps. The line continues to fluctuate between approximately 4.0 and 4.4 until 20000 training steps.
**R² Value (Orange Line):**
The line starts at approximately 0 at 0 training steps and increases rapidly to a peak of around 0.25 at approximately 500 training steps. It then declines to a minimum of approximately 0.05 at around 1500 training steps. After this decline, the line gradually increases, reaching a value of approximately 0.15 at 20000 training steps. The R² value exhibits significant oscillation throughout the training process.
Approximate Data Points:
| Training Steps | Information Gain | R² Value |
|---|---|---|
| 0 | 0 | 0 |
| 2000 | 2 | 0.2 |
| 5000 | 3.2 | 0.15 |
| 10000 | 4.2 | 0.1 |
| 12000 | 4.4 | 0.08 |
| 20000 | 4.1 | 0.15 |
### Key Observations
* Information Gain increases initially and then stabilizes, suggesting the model is learning and extracting useful information from the data.
* The R² value shows an initial increase, followed by a decrease and then a slow increase, indicating that the model's ability to explain the variance in the data fluctuates during training.
* The R² value remains relatively low throughout the training process, suggesting that the model does not explain a large proportion of the variance in the data.
* The Information Gain and R² value do not appear to be strongly correlated.
### Interpretation
The chart suggests that while the model is gaining information during training (as indicated by the increasing Information Gain), its ability to fit the data (as indicated by the R² value) is limited. The initial rapid increase in both metrics suggests a period of fast learning. The subsequent stabilization of Information Gain and fluctuating R² value could indicate that the model is reaching a point of diminishing returns, or that the data is inherently noisy or complex. The low R² value suggests that the model may not be a good fit for the data, or that additional features or a different model architecture may be needed. The divergence between the two metrics suggests that the information being gained isn't necessarily translating into improved model fit. This could be due to overfitting, or the presence of irrelevant features. Further investigation is needed to understand the reasons for the low R² value and the divergence between the two metrics.