## Bar Charts: Failed Edits per Trajectory (All) and Resolved
### Overview
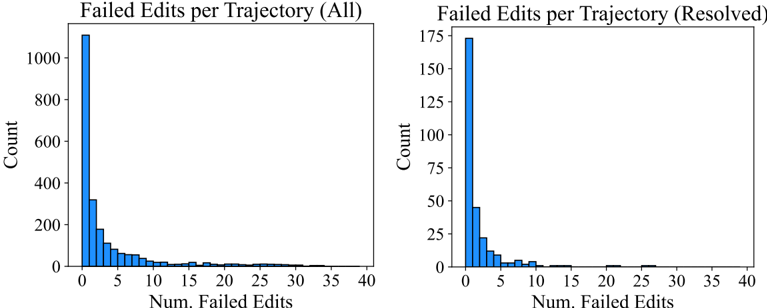
Two side-by-side bar charts compare the distribution of failed edits per trajectory. The left chart shows all trajectories ("Failed Edits per Trajectory (All)"), while the right chart focuses on resolved trajectories ("Failed Edits per Trajectory (Resolved)"). Both charts use a y-axis for "Count" and an x-axis for "Num. Failed Edits" (0–40). The left chart has a much larger scale (up to 1000) compared to the right (up to 175).
### Components/Axes
- **Left Chart (All Trajectories)**:
- **Y-axis**: "Count" (0–1000, increments of 200).
- **X-axis**: "Num. Failed Edits" (0–40, increments of 5).
- **Bars**: Blue, decreasing in height from left to right.
- **Right Chart (Resolved Trajectories)**:
- **Y-axis**: "Count" (0–175, increments of 25).
- **X-axis**: "Num. Failed Edits" (0–40, increments of 5).
- **Bars**: Blue, similar distribution to the left chart but with lower absolute counts.
### Detailed Analysis
#### Left Chart (All Trajectories)
- **0 Failed Edits**: ~1000 trajectories (tallest bar).
- **1–5 Failed Edits**: ~300 trajectories (next tallest bar).
- **6–10 Failed Edits**: ~100 trajectories (smaller bars).
- **11–40 Failed Edits**: <10 trajectories (negligible counts).
#### Right Chart (Resolved Trajectories)
- **0 Failed Edits**: ~175 trajectories (tallest bar).
- **1–5 Failed Edits**: ~50 trajectories (next tallest bar).
- **6–10 Failed Edits**: ~10 trajectories (smaller bars).
- **11–40 Failed Edits**: <1 trajectory (negligible counts).
### Key Observations
1. **Dominance of Zero Failed Edits**: Both charts show a sharp drop-off after 0 failed edits, indicating most trajectories have no failures.
2. **Long Tail of Failures**: A small fraction of trajectories (e.g., 1–5 failed edits) account for the majority of non-zero failures.
3. **Resolution Impact**: The resolved trajectories chart has significantly lower counts across all failure categories compared to the "All" chart, suggesting resolution reduces failure rates.
### Interpretation
The data demonstrates that **most trajectories experience no failed edits**, with a steep decline in frequency as the number of failures increases. The resolved trajectories chart reveals that even after addressing issues, a small subset of trajectories still encounters minor failures (1–5 edits), but these are far less frequent than in the unresolved dataset. This suggests that while most edits are successful, a minority of cases require iterative corrections, and resolution significantly mitigates failure rates. The long tail of failures in both charts highlights the need for targeted improvements in problematic workflows or user behaviors.