## Line Charts: Validation Loss vs. FLOPs for Different Input Types
### Overview
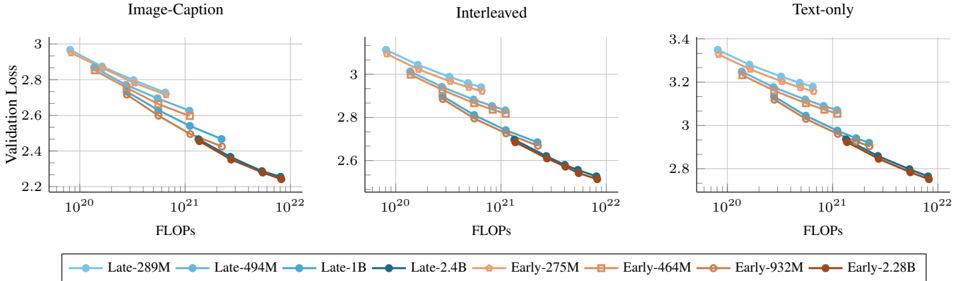
The image presents three line charts comparing the validation loss of different models against the number of floating-point operations (FLOPs) used during training. The charts are titled "Image-Caption", "Interleaved", and "Text-only", representing different input types used for training. Each chart displays multiple lines, each representing a different model size, with the model sizes ranging from 275M to 2.4B parameters. The x-axis represents FLOPs on a logarithmic scale, and the y-axis represents validation loss.
### Components/Axes
* **Titles:**
* Left Chart: "Image-Caption"
* Middle Chart: "Interleaved"
* Right Chart: "Text-only"
* **X-axis (Horizontal):**
* Label: "FLOPs"
* Scale: Logarithmic, with markers at 10^20, 10^21, and 10^22.
* **Y-axis (Vertical):**
* Label: "Validation Loss"
* Scale: Linear.
* Left Chart: Ranges from 2.2 to 3.0, with tick marks at intervals of 0.2.
* Middle Chart: Ranges from 2.6 to 3.4, with tick marks at intervals of 0.2.
* Right Chart: Ranges from 2.8 to 3.4, with tick marks at intervals of 0.2.
* **Legend (Bottom):**
* "Late-289M" (light blue, circle marker)
* "Late-494M" (light blue, square marker)
* "Late-1B" (light blue, no marker)
* "Late-2.4B" (dark blue, circle marker)
* "Early-275M" (light orange, circle marker)
* "Early-464M" (light orange, square marker)
* "Early-932M" (light orange, no marker)
* "Early-2.28B" (brown, circle marker)
### Detailed Analysis
**General Trend:** All lines in all three charts show a downward trend, indicating that validation loss decreases as the number of FLOPs increases. This suggests that the models generally improve with more training.
**Image-Caption Chart:**
* **Late-289M (light blue, circle):** Starts at approximately 2.9 and decreases to around 2.3.
* **Late-494M (light blue, square):** Starts at approximately 2.9 and decreases to around 2.3.
* **Late-1B (light blue, no marker):** Starts at approximately 2.8 and decreases to around 2.3.
* **Late-2.4B (dark blue, circle):** Starts at approximately 2.7 and decreases to around 2.3.
* **Early-275M (light orange, circle):** Starts at approximately 2.9 and decreases to around 2.3.
* **Early-464M (light orange, square):** Starts at approximately 2.8 and decreases to around 2.3.
* **Early-932M (light orange, no marker):** Starts at approximately 2.7 and decreases to around 2.3.
* **Early-2.28B (brown, circle):** Starts at approximately 2.7 and decreases to around 2.2.
**Interleaved Chart:**
* **Late-289M (light blue, circle):** Starts at approximately 3.1 and decreases to around 2.6.
* **Late-494M (light blue, square):** Starts at approximately 3.0 and decreases to around 2.6.
* **Late-1B (light blue, no marker):** Starts at approximately 3.0 and decreases to around 2.6.
* **Late-2.4B (dark blue, circle):** Starts at approximately 2.9 and decreases to around 2.6.
* **Early-275M (light orange, circle):** Starts at approximately 3.1 and decreases to around 2.6.
* **Early-464M (light orange, square):** Starts at approximately 3.0 and decreases to around 2.6.
* **Early-932M (light orange, no marker):** Starts at approximately 2.9 and decreases to around 2.6.
* **Early-2.28B (brown, circle):** Starts at approximately 2.9 and decreases to around 2.5.
**Text-only Chart:**
* **Late-289M (light blue, circle):** Starts at approximately 3.3 and decreases to around 2.9.
* **Late-494M (light blue, square):** Starts at approximately 3.3 and decreases to around 2.9.
* **Late-1B (light blue, no marker):** Starts at approximately 3.2 and decreases to around 2.9.
* **Late-2.4B (dark blue, circle):** Starts at approximately 3.1 and decreases to around 2.9.
* **Early-275M (light orange, circle):** Starts at approximately 3.3 and decreases to around 2.9.
* **Early-464M (light orange, square):** Starts at approximately 3.2 and decreases to around 2.9.
* **Early-932M (light orange, no marker):** Starts at approximately 3.1 and decreases to around 2.9.
* **Early-2.28B (brown, circle):** Starts at approximately 3.0 and decreases to around 2.8.
### Key Observations
* The "Text-only" chart generally shows higher validation loss values compared to the "Image-Caption" and "Interleaved" charts, suggesting that models trained solely on text data perform worse than those trained with image and caption data.
* The "Image-Caption" chart shows the lowest validation loss values, indicating that this input type leads to the best model performance.
* The "Early-2.28B" model (brown line) consistently achieves the lowest validation loss across all three charts, suggesting that larger models trained early in the process perform better.
* The validation loss decreases more rapidly in the beginning and then plateaus as FLOPs increase, indicating diminishing returns from additional training.
### Interpretation
The data suggests that incorporating image information into the training process (as seen in "Image-Caption" and "Interleaved" charts) leads to better model performance compared to using text data alone ("Text-only" chart). The "Image-Caption" input type appears to be the most effective. Furthermore, larger models (like "Early-2.28B") tend to achieve lower validation loss, indicating better generalization. The diminishing returns observed with increasing FLOPs suggest that there is a point beyond which additional training provides minimal improvement in validation loss. The "Early" vs "Late" training regime seems to have a significant impact, with "Early" models generally performing better, especially the largest one.