## Line Charts: Validation Loss vs. Computational Cost (FLOPs) Across Three Training Paradigms
### Overview
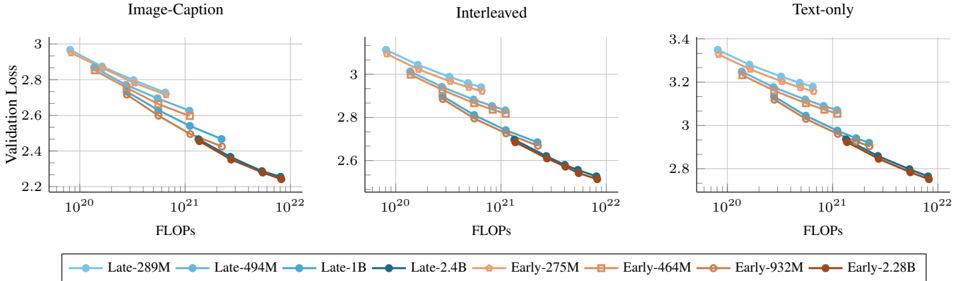
The image displays three line charts arranged horizontally, comparing the relationship between computational cost (measured in FLOPs) and model performance (measured by Validation Loss) for different model sizes and training paradigms. The three charts are titled "Image-Caption", "Interleaved", and "Text-only". All charts share a common legend and axis labels.
### Components/Axes
* **Titles (Top of each chart):**
* Left Chart: `Image-Caption`
* Center Chart: `Interleaved`
* Right Chart: `Text-only`
* **Y-Axis (Vertical, Left side of each chart):** Label is `Validation Loss`. The scale is linear but varies between charts.
* Image-Caption: Ranges from ~2.2 to 3.0.
* Interleaved: Ranges from ~2.5 to 3.1.
* Text-only: Ranges from ~2.7 to 3.4.
* **X-Axis (Horizontal, Bottom of each chart):** Label is `FLOPs`. The scale is logarithmic (base 10), with major tick marks at `10^20`, `10^21`, and `10^22`.
* **Legend (Bottom, spanning all charts):** Contains 8 entries, divided into two color-coded groups.
* **"Late" Group (Blue hues, Circle markers):**
* `Late-289M` (Light blue)
* `Late-494M` (Medium blue)
* `Late-1B` (Darker blue)
* `Late-2.4B` (Darkest blue)
* **"Early" Group (Orange/Brown hues, Square markers):**
* `Early-275M` (Light orange)
* `Early-464M` (Medium orange)
* `Early-932M` (Darker orange/brown)
* `Early-2.28B` (Darkest brown)
### Detailed Analysis
**General Trend (All Charts):** For every data series, the Validation Loss decreases as the number of FLOPs increases. The lines slope downward from left to right, indicating that more computational training leads to better model performance (lower loss).
**Chart 1: Image-Caption**
* **Trend:** All lines show a steady, roughly linear decline on the log-linear plot.
* **Data Points & Relationships:**
* At the lowest FLOPs (~10^20), the "Late" models (blue circles) start with a higher loss (~2.95-3.0) than the "Early" models (orange squares, ~2.85-2.9).
* As FLOPs increase, the gap narrows. By the highest FLOPs (~10^22), all models converge to a very similar loss value, approximately 2.25.
* Within each group, larger models (darker colors) consistently achieve lower loss at the same FLOP count.
**Chart 2: Interleaved**
* **Trend:** Similar downward slope to the first chart.
* **Data Points & Relationships:**
* The overall loss values are slightly higher than in the Image-Caption chart.
* The initial gap between "Late" and "Early" groups is present but appears slightly smaller.
* Convergence at high FLOPs is again observed, with all models reaching a loss of approximately 2.55.
* The ordering of model sizes within each color group is preserved.
**Chart 3: Text-only**
* **Trend:** Consistent downward slope.
* **Data Points & Relationships:**
* This chart has the highest overall Validation Loss values.
* The separation between the "Late" (blue) and "Early" (orange) groups is most distinct here, especially at lower to mid-range FLOPs.
* The convergence at the highest FLOPs (~10^22) is less complete than in the other two charts. The "Late" models still appear to have a marginally lower loss (~2.75) than the "Early" models (~2.78).
### Key Observations
1. **Universal Scaling Law:** All models, regardless of size or training paradigm, follow a clear power-law relationship: validation loss decreases predictably with increased compute (FLOPs).
2. **Paradigm Efficiency:** For a given FLOP budget, the "Image-Caption" and "Interleaved" paradigms achieve lower validation loss than the "Text-only" paradigm. This suggests multimodal training is more data/compute efficient for the measured task.
3. **Model Size vs. Compute:** At lower compute budgets, larger models (within a group) are more efficient (lower loss per FLOP). However, with sufficient compute, smaller models can eventually match the performance of larger ones.
4. **"Late" vs. "Early" Distinction:** The "Late" models (blue) consistently start with higher loss but often show a steeper improvement curve, nearly catching up to or matching the "Early" models (orange) at high compute. This pattern is most pronounced in the "Text-only" task.
### Interpretation
The data demonstrates fundamental scaling laws in machine learning, where performance improves predictably with computational investment. The key insight is the **task-dependent efficiency of scaling**. Multimodal training ("Image-Caption", "Interleaved") appears to provide a better learning signal, allowing models to achieve lower loss with the same computational resources compared to text-only training. This could be because visual grounding provides richer context or regularizes the learning process.
The convergence of different-sized models at high FLOPs suggests a **compute-optimal frontier**: for any given total compute budget, there is an optimal model size. Training a very large model with insufficient data (low FLOPs) is inefficient, while a smaller model trained with ample compute can be highly effective. The persistent gap in the "Text-only" chart may indicate that text-only learning has a higher sample complexity or requires even more compute to close the performance gap between model sizes. This analysis is crucial for guiding resource allocation in large-scale model training.