\n
## Line Chart: Accuracy vs. Thinking Compute
### Overview
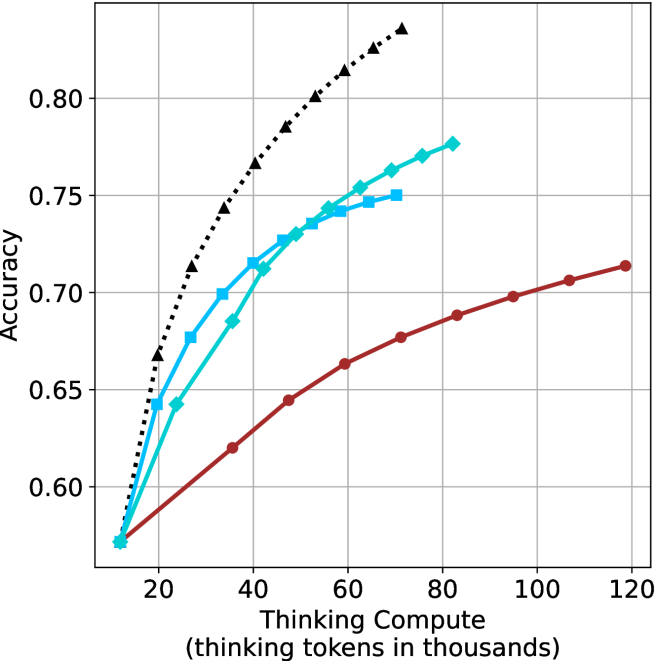
This image presents a line chart illustrating the relationship between "Thinking Compute" (measured in thousands of tokens) and "Accuracy". Four distinct data series are plotted, each represented by a different colored line with corresponding markers. The chart appears to demonstrate how accuracy improves with increased computational effort (thinking tokens) for different approaches or models.
### Components/Axes
* **X-axis:** "Thinking Compute (thinking tokens in thousands)". Scale ranges from approximately 0 to 120, with markers at 20, 40, 60, 80, 100, and 120.
* **Y-axis:** "Accuracy". Scale ranges from approximately 0.60 to 0.82, with markers at 0.60, 0.65, 0.70, 0.75, and 0.80.
* **Data Series:** Four lines are present, each with a distinct color and marker style:
* Black dashed line with triangle markers.
* Cyan solid line with square markers.
* Blue solid line with circle markers.
* Red solid line with circle markers.
* **Gridlines:** A grid is present to aid in reading values.
### Detailed Analysis
Let's analyze each data series individually:
* **Black (Dashed Triangle):** This line exhibits the steepest upward slope, indicating the fastest increase in accuracy with increasing compute.
* At 20k tokens: Approximately 0.68 accuracy.
* At 40k tokens: Approximately 0.76 accuracy.
* At 60k tokens: Approximately 0.79 accuracy.
* At 80k tokens: Approximately 0.80 accuracy.
* At 100k tokens: Approximately 0.81 accuracy.
* At 120k tokens: Approximately 0.81 accuracy.
* **Cyan (Solid Square):** This line shows a strong upward trend, but less steep than the black line.
* At 20k tokens: Approximately 0.64 accuracy.
* At 40k tokens: Approximately 0.73 accuracy.
* At 60k tokens: Approximately 0.76 accuracy.
* At 80k tokens: Approximately 0.77 accuracy.
* At 100k tokens: Approximately 0.77 accuracy.
* At 120k tokens: Approximately 0.77 accuracy.
* **Blue (Solid Circle):** This line demonstrates a similar trend to the cyan line, but starts at a slightly higher accuracy and plateaus earlier.
* At 20k tokens: Approximately 0.66 accuracy.
* At 40k tokens: Approximately 0.74 accuracy.
* At 60k tokens: Approximately 0.76 accuracy.
* At 80k tokens: Approximately 0.77 accuracy.
* At 100k tokens: Approximately 0.77 accuracy.
* At 120k tokens: Approximately 0.77 accuracy.
* **Red (Solid Circle):** This line exhibits the slowest increase in accuracy with increasing compute.
* At 20k tokens: Approximately 0.60 accuracy.
* At 40k tokens: Approximately 0.66 accuracy.
* At 60k tokens: Approximately 0.68 accuracy.
* At 80k tokens: Approximately 0.69 accuracy.
* At 100k tokens: Approximately 0.70 accuracy.
* At 120k tokens: Approximately 0.71 accuracy.
### Key Observations
* The black data series consistently outperforms the other three, achieving the highest accuracy across all compute levels.
* The red data series consistently underperforms, showing the smallest gains in accuracy with increased compute.
* The cyan and blue lines are relatively close in performance, plateauing at similar accuracy levels around 0.77.
* All lines show diminishing returns in accuracy as compute increases, with the rate of improvement slowing down at higher compute levels.
### Interpretation
The chart suggests that increasing "Thinking Compute" generally leads to improved "Accuracy," but the effectiveness of this approach varies significantly depending on the method or model being used. The black line likely represents a more efficient or advanced technique that leverages increased compute to achieve substantial accuracy gains. The red line represents a less effective approach, where increasing compute yields only marginal improvements. The cyan and blue lines represent intermediate strategies.
The plateauing of the lines at higher compute levels indicates that there are inherent limitations to the accuracy that can be achieved, even with substantial computational resources. This could be due to factors such as data quality, model architecture, or the inherent complexity of the task. The chart highlights the importance of optimizing the "Thinking Compute" strategy to maximize accuracy gains and avoid wasting resources on diminishing returns.