## Line Chart: Accuracy vs. Thinking Compute for Different Reasoning Methods
### Overview
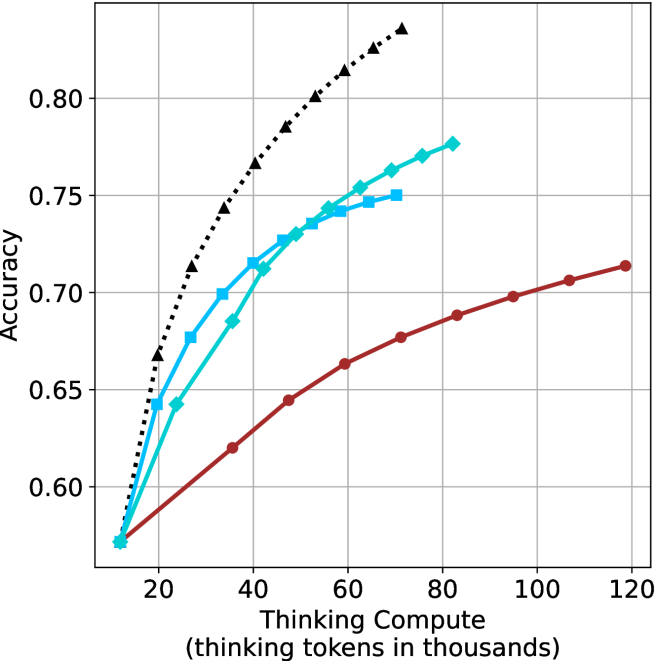
This is a line chart plotting model accuracy against computational cost, measured in "thinking tokens." It compares the performance scaling of four distinct reasoning or prompting methods as more computational resources (thinking tokens) are allocated. The chart demonstrates that all methods improve with more compute, but at significantly different rates and with different efficiency profiles.
### Components/Axes
* **X-Axis:** Labeled "Thinking Compute (thinking tokens in thousands)". The scale runs from 0 to 120, with major tick marks at 20, 40, 60, 80, 100, and 120. The unit is thousands of tokens.
* **Y-Axis:** Labeled "Accuracy". The scale runs from 0.60 to 0.80, with major tick marks at 0.60, 0.65, 0.70, 0.75, and 0.80.
* **Legend:** Positioned in the top-left corner of the chart area. It contains four entries, each with a distinct line style and marker:
1. **Black dotted line with upward-pointing triangles (▲):** "Chain-of-Thought (CoT)"
2. **Cyan solid line with diamonds (◆):** "Self-Consistency (SC)"
3. **Cyan solid line with squares (■):** "Tree of Thoughts (ToT)"
4. **Red solid line with circles (●):** "Reasoning via Planning (RAP)"
* **Grid:** A light gray grid is present, aligning with the major ticks on both axes.
### Detailed Analysis
**Trend Verification & Data Point Extraction (Approximate):**
1. **Chain-of-Thought (CoT) - Black dotted line with triangles:**
* **Trend:** Shows the steepest, near-linear upward slope. It demonstrates the highest accuracy gain per unit of additional compute.
* **Data Points (Compute k, Accuracy):** Starts at (~10k, ~0.57). Passes through (~20k, ~0.67), (~30k, ~0.72), (~40k, ~0.76), (~50k, ~0.79), (~60k, ~0.81), and ends near (~70k, ~0.83).
2. **Self-Consistency (SC) - Cyan solid line with diamonds:**
* **Trend:** Shows a strong, slightly curving upward slope. It is the second most efficient method, closely following CoT initially but with a slightly less steep trajectory at higher compute.
* **Data Points (Compute k, Accuracy):** Starts at (~10k, ~0.57). Passes through (~20k, ~0.64), (~30k, ~0.68), (~40k, ~0.71), (~50k, ~0.73), (~60k, ~0.75), (~70k, ~0.77), and ends near (~80k, ~0.78).
3. **Tree of Thoughts (ToT) - Cyan solid line with squares:**
* **Trend:** Shows a moderate upward curve that begins to plateau earlier than SC. Its slope is less steep than both CoT and SC.
* **Data Points (Compute k, Accuracy):** Starts at (~10k, ~0.57). Passes through (~20k, ~0.65), (~30k, ~0.70), (~40k, ~0.72), (~50k, ~0.74), (~60k, ~0.75), and ends near (~70k, ~0.75). The line appears to terminate or merge with the SC line around 70k.
4. **Reasoning via Planning (RAP) - Red solid line with circles:**
* **Trend:** Shows the most gradual, shallow upward slope. It requires significantly more compute to achieve smaller gains in accuracy compared to the other methods.
* **Data Points (Compute k, Accuracy):** Starts at (~10k, ~0.57). Passes through (~20k, ~0.59), (~30k, ~0.62), (~40k, ~0.64), (~50k, ~0.66), (~60k, ~0.68), (~70k, ~0.69), (~80k, ~0.70), (~90k, ~0.71), (~100k, ~0.71), and ends near (~120k, ~0.72).
**Spatial Grounding & Cross-Reference:**
* All four lines originate from approximately the same point at the lowest compute value (~10k tokens, ~0.57 accuracy).
* The legend in the top-left correctly maps to the lines: The black dotted line with triangles is the highest line (CoT). The two cyan lines are in the middle, with the diamond-marked line (SC) ultimately above the square-marked line (ToT). The red line with circles (RAP) is consistently the lowest line.
### Key Observations
1. **Universal Starting Point:** All methods begin at near-identical performance for minimal compute, suggesting a common baseline capability.
2. **Diverging Efficiency:** A dramatic divergence in scaling efficiency occurs immediately after the starting point. CoT scales most efficiently, followed by SC, then ToT, with RAP being the least compute-efficient.
3. **Crossover Point:** The SC (diamonds) and ToT (squares) lines cross between 40k and 50k tokens. Below this point, ToT has a slight edge; above it, SC becomes more accurate for the same compute.
4. **Plateauing:** ToT shows the earliest signs of performance plateauing, with its curve flattening noticeably after ~60k tokens. RAP also shows a very gradual slope, indicating diminishing returns.
5. **No Upper Bound Shown:** The chart does not show a clear performance ceiling for any method within the plotted range, though the slopes suggest CoT and SC would continue to rise if the x-axis were extended.
### Interpretation
This chart provides a clear empirical comparison of the "return on investment" for different AI reasoning strategies. It answers the critical question: "If I spend more computational budget on making a model 'think harder,' which method will give me the most accuracy boost?"
* **What the data suggests:** **Chain-of-Thought (CoT)** is the most efficient method for converting additional thinking compute into accuracy gains within this regime. **Self-Consistency (SC)** is a strong second, offering a good balance. **Tree of Thoughts (ToT)** provides intermediate gains but may hit diminishing returns sooner. **Reasoning via Planning (RAP)** is the least efficient, requiring substantially more tokens for smaller improvements.
* **Relationship between elements:** The chart illustrates a fundamental trade-off in AI system design: the choice of reasoning architecture dramatically impacts computational cost-effectiveness. The crossing of SC and ToT lines indicates there is no universally "best" method; the optimal choice can depend on the available compute budget.
* **Notable implications:** For applications where compute cost or latency is a primary constraint, CoT or SC would be preferable. RAP's shallow slope might be justified only if it offers other unmeasured benefits (e.g., better interpretability, robustness, or performance on a different, more complex task distribution not captured by this accuracy metric). The chart strongly argues that simply "adding more compute" is not a uniform strategy—the method used to structure that compute is paramount.