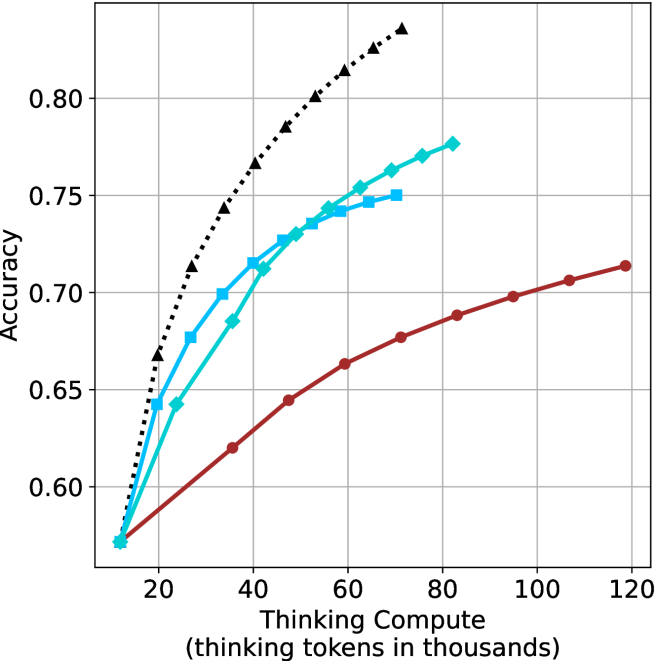
## Line Chart: Accuracy vs. Thinking Compute (Tokens in Thousands)
### Overview
The chart illustrates the relationship between computational resources (measured in "thinking tokens in thousands") and accuracy across three distinct data series. The x-axis represents computational scale, while the y-axis measures accuracy on a 0.55–0.85 scale. Three lines are plotted: a theoretical maximum (black dashed), Model A (blue squares), and Model B (red circles).
### Components/Axes
- **X-axis**: "Thinking Compute (thinking tokens in thousands)" with ticks at 20, 40, 60, 80, 100, 120.
- **Y-axis**: "Accuracy" with ticks at 0.55, 0.60, 0.65, 0.70, 0.75, 0.80, 0.85.
- **Legend**: Located in the top-right corner, associating:
- Black dashed line: "Theoretical Maximum"
- Blue squares: "Model A"
- Red circles: "Model B"
### Detailed Analysis
1. **Theoretical Maximum (Black Dashed Line)**:
- Starts at (20, 0.55) and ascends steadily to (120, 0.85).
- Intermediate points: (40, 0.65), (60, 0.72), (80, 0.78), (100, 0.82).
- Represents an idealized upper bound for accuracy.
2. **Model A (Blue Squares)**:
- Begins at (20, 0.55) and rises sharply to (80, 0.77).
- Peaks at (80, 0.77) before declining to (120, 0.75).
- Intermediate points: (40, 0.65), (60, 0.72), (100, 0.76).
3. **Model B (Red Circles)**:
- Starts at (20, 0.55) and increases gradually to (120, 0.72).
- Intermediate points: (40, 0.62), (60, 0.66), (80, 0.69), (100, 0.71).
### Key Observations
- **Theoretical Maximum** consistently outperforms both models across all compute levels.
- **Model A** exhibits a "peak-and-decline" pattern, suggesting diminishing returns or instability at higher compute levels.
- **Model B** demonstrates steady, linear improvement without overshooting or plateauing.
- All models share the same starting point (20, 0.55), indicating baseline performance at minimal compute.
### Interpretation
The data suggests that computational scale correlates with improved accuracy, but the relationship varies by model. The **Theoretical Maximum** line implies a hard upper limit for achievable accuracy. **Model A**'s decline after 80k tokens may indicate architectural limitations or overfitting at scale, while **Model B**'s linear growth suggests more efficient scaling. The divergence between models highlights trade-offs in design choices for handling increased compute. Notably, no model reaches the theoretical maximum, emphasizing practical constraints in real-world implementations.