\n
## Line Chart: Accuracy vs. Time
### Overview
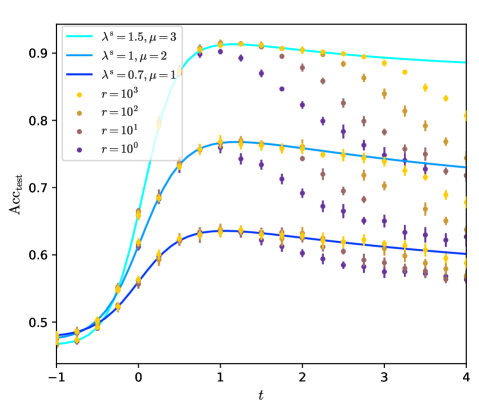
The image presents a line chart illustrating the relationship between accuracy (A<sub>Acctest</sub>) and time (t) for different parameter settings. Several lines represent different combinations of λ<sup>σ</sup> and μ values, while scatter points represent data for varying values of 'r'. The chart appears to demonstrate how accuracy evolves over time under different conditions.
### Components/Axes
* **X-axis:** Labeled "t", representing time. The scale ranges from approximately -1 to 4.
* **Y-axis:** Labeled "A<sub>Acctest</sub>", representing accuracy. The scale ranges from approximately 0.5 to 0.95.
* **Lines:**
* Light Cyan: λ<sup>σ</sup> = 1.5, μ = 3
* Blue: λ<sup>σ</sup> = 1, μ = 2
* Dark Cyan: λ<sup>σ</sup> = 0.7, μ = 1
* **Scatter Points:**
* Yellow: r = 10<sup>3</sup>
* Orange: r = 10<sup>2</sup>
* Purple: r = 10<sup>1</sup>
* Dark Purple: r = 10<sup>0</sup>
* **Legend:** Located in the top-left corner of the chart, clearly associating colors with parameter values.
### Detailed Analysis
The chart displays several distinct trends.
* **Light Cyan Line (λ<sup>σ</sup> = 1.5, μ = 3):** This line exhibits a rapid initial increase in accuracy, reaching approximately 0.85 at t = 0.5. It then plateaus, maintaining an accuracy of around 0.87-0.88 from t = 1 onwards.
* **Blue Line (λ<sup>σ</sup> = 1, μ = 2):** This line also shows an initial increase in accuracy, but at a slower rate than the light cyan line. It reaches approximately 0.75 at t = 0.5 and plateaus around 0.82-0.83 from t = 1 onwards.
* **Dark Cyan Line (λ<sup>σ</sup> = 0.7, μ = 1):** This line demonstrates the slowest initial increase in accuracy, reaching approximately 0.65 at t = 0.5. It plateaus around 0.67-0.68 from t = 1 onwards.
* **Yellow Scatter Points (r = 10<sup>3</sup>):** These points show a relatively stable accuracy around 0.88-0.9, with some fluctuations. The accuracy appears to be highest among all the data series.
* **Orange Scatter Points (r = 10<sup>2</sup>):** These points exhibit a fluctuating accuracy, starting around 0.7 at t = -1 and reaching a peak of approximately 0.82 at t = 1. It then declines to around 0.75 at t = 4.
* **Purple Scatter Points (r = 10<sup>1</sup>):** These points show a fluctuating accuracy, starting around 0.6 at t = -1 and reaching a peak of approximately 0.73 at t = 1. It then declines to around 0.68 at t = 4.
* **Dark Purple Scatter Points (r = 10<sup>0</sup>):** These points exhibit a fluctuating accuracy, starting around 0.55 at t = -1 and reaching a peak of approximately 0.65 at t = 1. It then declines to around 0.6 at t = 4.
### Key Observations
* Higher values of λ<sup>σ</sup> and μ generally lead to faster increases in accuracy and higher overall accuracy levels.
* The scatter points representing different 'r' values show more variability in accuracy compared to the smooth lines representing the λ<sup>σ</sup> and μ combinations.
* The accuracy for all series appears to stabilize after t = 1.
* The 'r' values of 10<sup>3</sup> consistently demonstrate the highest accuracy.
### Interpretation
The chart suggests that the parameters λ<sup>σ</sup> and μ significantly influence the rate and level of accuracy achieved over time. The lines demonstrate a clear trend: increasing λ<sup>σ</sup> and μ leads to faster convergence and higher accuracy. The scatter points, representing different 'r' values, indicate that the initial conditions or some other factor represented by 'r' also play a role in the accuracy, but with more variability.
The stabilization of accuracy after t = 1 suggests that the system reaches a steady state or equilibrium point. The differences in accuracy between the lines and scatter points could be due to the underlying mechanisms governing the system's behavior. The higher accuracy observed for r = 10<sup>3</sup> might indicate that larger initial values of 'r' promote more stable and accurate outcomes.
The chart could be representing the learning curve of a model or the convergence of an algorithm under different parameter settings. The λ<sup>σ</sup> and μ parameters might represent learning rates or regularization strengths, while 'r' could represent the size of the training dataset or the complexity of the problem. The data suggests that careful tuning of these parameters is crucial for achieving optimal performance.