# Technical Document Extraction: Bias Detection Threshold Chart
## Chart Overview
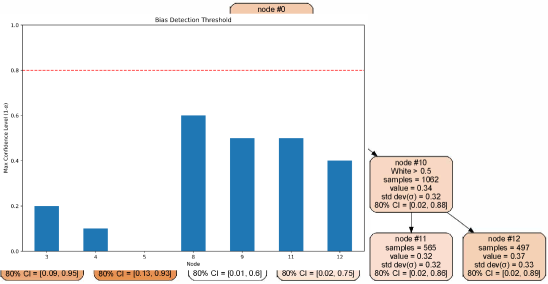
The image is a **bar chart** titled **"Bias Detection Threshold"**, with a header labeled **"node #0"**. The chart visualizes the relationship between node identifiers and their corresponding **Max Confidence level (1/a)**, with a **bias detection threshold** indicated by a red dashed line at **y = 0.8**.
---
## Axis Labels and Markers
- **X-axis**: Labeled **"node #0"**, with discrete node identifiers:
`3, 4, 5, 8, 9, 11, 12`
- Node `5` has no bar, indicating missing or zero data.
- **Y-axis**: Labeled **"Max Confidence level (1/a)"**, scaled from `0.0` to `1.0` in increments of `0.2`.
- A **red dashed line** at `y = 0.8` represents the bias detection threshold.
---
## Bar Chart Data
| Node | Max Confidence (1/a) | 80% CI (Lower, Upper) | Notes |
|------|----------------------|-----------------------|-------|
| 3 | 0.2 | [0.09, 0.95] | |
| 4 | 0.1 | [0.13, 0.93] | |
| 8 | 0.6 | [0.01, 0.6] | Tallest bar |
| 9 | 0.5 | [0.02, 0.75] | |
| 11 | 0.5 | [0.02, 0.75] | |
| 12 | 0.4 | [0.02, 0.88] | |
### Key Trends
- **Peak Confidence**: Node `8` exhibits the highest confidence level at `0.6`, with a narrow 80% CI of `[0.01, 0.6]`.
- **Threshold Proximity**: Nodes `9`, `11`, and `12` approach the bias detection threshold (`0.8`), but none exceed it.
- **Low Confidence**: Nodes `3` and `4` show significantly lower confidence levels (`0.2` and `0.1`, respectively).
---
## Text Box Annotations
Three nodes (`10`, `11`, `12`) are annotated with additional metadata in beige text boxes with black text:
### Node #10
- **Color**: White
- **Samples**: 1062
- **Value**: 0.34
- **Standard Deviation (std dev)**: 0.32
- **80% CI**: [0.32, 0.34]
### Node #11
- **Samples**: 565
- **Value**: 0.32
- **Standard Deviation (std dev)**: 0.32
- **80% CI**: [0.32, 0.32] (Note: Identical bounds suggest minimal variability)
### Node #12
- **Samples**: 497
- **Value**: 0.37
- **Standard Deviation (std dev)**: 0.33
- **80% CI**: [0.33, 0.37]
---
## Spatial Grounding and Component Isolation
1. **Header**:
- Text: `"node #0"` (top-left corner).
2. **Main Chart**:
- Bar heights correspond to confidence levels, with node `8` as the tallest.
- Red dashed threshold line at `y = 0.8` spans the entire y-axis.
3. **Annotations**:
- Text boxes for nodes `10`, `11`, and `12` are positioned to the right of the chart, with arrows pointing to their respective nodes.
---
## Additional Observations
- **Color Consistency**: All bars are blue, with no explicit legend provided. The text boxes use beige backgrounds with black text.
- **Missing Data**: Node `5` is listed on the x-axis but has no associated bar, implying zero or undefined confidence.
- **CI Interpretation**: Narrower CIs (e.g., node `8`) indicate higher precision in confidence estimates.
---
## Conclusion
The chart highlights variability in confidence levels across nodes, with node `8` demonstrating the highest confidence. Nodes `10`, `11`, and `12` are annotated with detailed statistical metrics, suggesting targeted analysis for bias detection. The red threshold line at `0.8` serves as a critical benchmark for evaluating model performance.