# Technical Document Extraction: Bias Detection Analysis
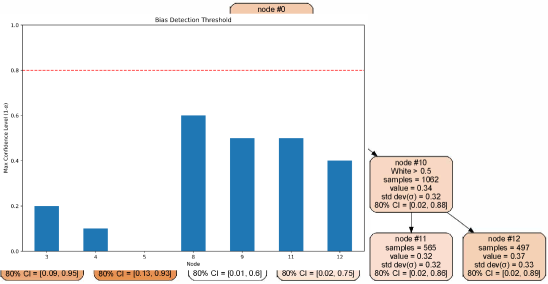
This document provides a comprehensive extraction of the data and structural components from the provided image, which depicts a statistical analysis of bias detection across different nodes in a decision tree or similar hierarchical model.
## 1. Component Isolation
The image is divided into three primary functional regions:
* **Header:** Contains the root node identifier.
* **Main Chart (Left):** A bar chart showing confidence levels across specific nodes.
* **Decision Tree Fragment (Right):** A diagram showing the relationship and statistical properties of nodes 10, 11, and 12.
* **Footer:** Contains confidence interval (CI) data for specific nodes.
---
## 2. Header Information
* **Top Label:** `node #0` (contained in a light orange rounded rectangle).
---
## 3. Main Chart: Bias Detection Threshold
This is a bar chart measuring confidence levels against a predefined threshold.
### Metadata
* **Title:** Bias Detection Threshold
* **Y-Axis Label:** Max Confidence Level (1-α)
* **Y-Axis Scale:** 0.0 to 1.0 (increments of 0.2)
* **X-Axis Label:** Node
* **X-Axis Categories:** 3, 4, 5, 8, 9, 11, 12
* **Threshold Line:** A horizontal red dashed line is positioned at **y = 0.8**.
### Data Points (Bar Heights)
| Node | Visual Height (Approx. Value) | Trend Description |
| :--- | :--- | :--- |
| 3 | 0.2 | Low confidence. |
| 4 | 0.1 | Decrease from node 3. |
| 5 | 0.0 | No bar visible; value is zero or null. |
| 8 | 0.6 | Significant increase; highest bar in the set. |
| 9 | 0.5 | Slight decrease from node 8. |
| 11 | 0.5 | Equal to node 9. |
| 12 | 0.4 | Slight decrease from node 11. |
**Trend Observation:** All nodes remain below the red dashed "Bias Detection Threshold" of 0.8, indicating that none of the nodes have reached the critical threshold for bias detection based on the "Max Confidence Level."
---
## 4. Decision Tree Diagram (Right Side)
This section details the flow and statistical breakdown of a specific branch.
### Node #10 (Parent)
* **Condition:** `White > 0.5`
* **Samples:** 1062
* **Value:** 0.34
* **Std Dev (σ):** 0.32
* **80% CI:** [0.02, 0.88]
### Node #11 (Left Child of 10)
* **Samples:** 565
* **Value:** 0.32
* **Std Dev (σ):** 0.32
* **80% CI:** [0.02, 0.86]
### Node #12 (Right Child of 10)
* **Samples:** 497
* **Value:** 0.37
* **Std Dev (σ):** 0.33
* **80% CI:** [0.02, 0.89]
---
## 5. Footer: Confidence Intervals
The footer contains four distinct labels corresponding to the 80% Confidence Intervals for various nodes.
| Node Reference (Implicit) | Text Content | Color Coding |
| :--- | :--- | :--- |
| Node 3 (Approx) | `80% CI = [0.09, 0.95]` | Dark Orange |
| Node 4 (Approx) | `80% CI = [0.13, 0.93]` | Dark Orange |
| Node 8/9 (Approx) | `80% CI = [0.01, 0.6]` | White/Grey |
| Node 11/12 (Approx) | `80% CI = [0.02, 0.75]` | White/Grey |
---
## 6. Summary of Findings
The visualization indicates a bias detection process where multiple nodes (3, 4, 8, 9, 11, 12) are evaluated. While Node 8 shows the highest confidence level (~0.6), it still falls short of the 0.8 threshold required for a positive bias detection. The tree fragment shows that splitting Node 10 (based on the "White" attribute) results in two sub-groups (Nodes 11 and 12) with similar standard deviations but slightly different mean values (0.32 vs 0.37).